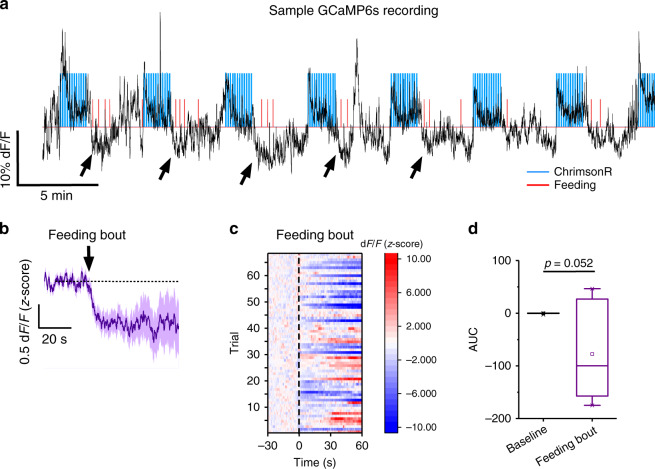
Fig. 5. Feeding behavior is associated with decreases in GCaMP6s fluorescence in pPVT–NAc neurons.
a Representative trace showing the effect of light stimulation (blue lines) on GCaMP6s fluorescence of pPVT–NAc neurons (black line). Notice that initiation of food intake (red lines) was immediately followed by decreases in the fluorescence of the GCaMP6s signal (depicted with black arrowheads). b Average GCaMP6s response from pPVT–NAc neurons following the onset of a feeding bout (illustrated by the black arrow). c Heatmap of individual trials GCaMP6s responses to the initiation of feeding bouts from ChrimsonR-expressing mice. d Quantification of feeding bouts onset changes in GCaMP6s fluorescence in pPVT–NAc neurons. AUC, Baseline, −0.47 ± 0.38; Feeding bout, –77.48 ± 35.16; n = 7 mice, two-sided Paired t-test, P = 0.052. Box chart legend: box is defined by 25th, 75th percentiles, whiskers are determined by 5th and 95th percentiles, and mean is depicted by the square symbol. Data presented as mean ± SEM.

