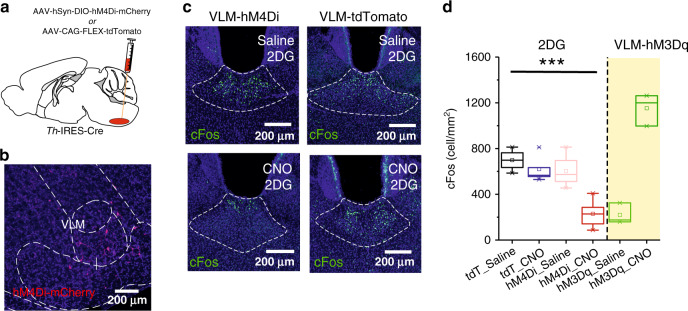
Fig. 6. VLMCA neurons mediate glucoprivation-induced activation of the pPVT.
a Schematic of the stereotaxic injections for selective expression of DREADDi (hM4Di-mCherry) in VLMCA neurons of TH-IRES-Cre mice. b Representative images of the VLM from a TH-IRES-Cre mouse expressing the hM4Di-mCherry virus. c Representative images showing cFos immunohistochemistry in the pPVT of mice expressing either the hM4Di-mCherry (left) or tdTomato control virus (right) in the VLMCA and injected with either saline (top) or with CNO (bottom), 30 min before administration of 2DG. d Quantification of cFos immunoreactivity in PVT as cells/mm2, tdT-Saline, 698.85 ± 46.88, n = 6 mice; tdT-CNO, 619.06 ± 51.00, n = 6 mice; hM4Di-Saline, 603.80 ± 53.13, n = 6 mice; hM4Di-CNO, 229.65 ± 46.19, n = 6 mice; effect of treatments, F(1,17) = 19.70, P < 0.001; effect of virus, F(1,17) = 22.43, P < 0.001; interaction, F(1,17) = 8.28, P < 0.05, two-way analysis of variance (ANOVA) followed by Tukey’s test. Group comparisons: tdT_Saline vs hM4Di_CNO, ***P = 0.00004, tdT_CNO vs hM4Di_CNO, ***P = 0.0002, hM4Di_Saline vs hM4Di_CNO, ***P = 0.0002. Data from Supplementary Fig. 4 included for comparison purposes (shaded portion of the graph). Box chart legend: box is defined by 25th, 75th percentiles, whiskers are determined by 5th and 95th percentiles, and mean is depicted by the square symbol. Data presented as mean ± SEM.

