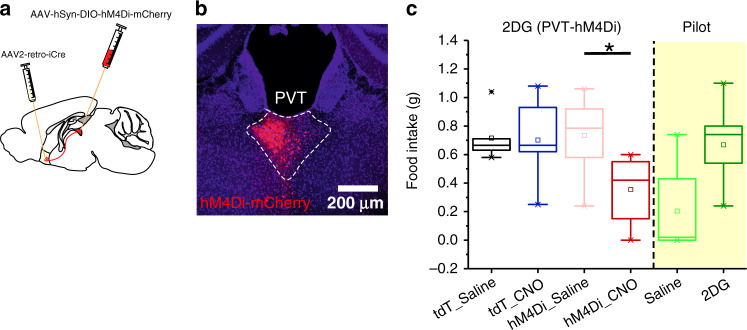
Fig. 8. pPVT–NAc neuron activity is required for glucoprivation-induced feeding behavior.
a Schematic of the stereotaxic injections for selective expression of the hM4Di-mCherry and control viral vectors in pPVT–NAc neurons. b Representative image of hM4Di-mCherry expression in pPVT–NAc neurons. c Quantification of food intake for a 5-h period after 2DG administration. Mice expressing either hM4Di or the control virus in pPVT–NAc neurons were injected with either saline or CNO, 30 min prior to 2DG administration. pPVT–Nac neurons inhibition suppressed the 2DG-induced increases in feeding behavior. Total food intake in grams, tdT_Saline, 0.72 ± 0.07, n = 6 mice; tdT_CNO, 0.70 ± 0.08, n = 6 mice; hM4Di_Saline, 0.73 ± 0.07, n = 8 mice; hM4Di_CNO, 0.36 ± 0.09, n = 8 mice; effect of treatments, F(1,24) = 4.35, P < 0.05; effect of virus, F(1,24) = 3.05, P > 0.05; interaction, F(1,24) = 3.78, P > 0.05, two-way analysis of variance (ANOVA) followed by Tukey’s test. Group comparisons: tdT_Saline vs tdT_CNO, P = 0.99, tdT_Saline vs hM4Di_Saline, P = 1.00, tdT_Saline vs hM4Di_CNO, P = 0.06, tdT_CNO vs hM4Di_CNO, P = 0.07; hM4Di_Saline vs hM4Di_CNO, *P = 0.02. Data from Supplementary Fig. 8 included for comparison purposes (shaded portion of the graph). Box chart legend: box is defined by 25th, 75th percentiles, whiskers are determined by 5th and 95th percentiles, and mean is depicted by the square symbol. Data presented as mean ± SEM.

