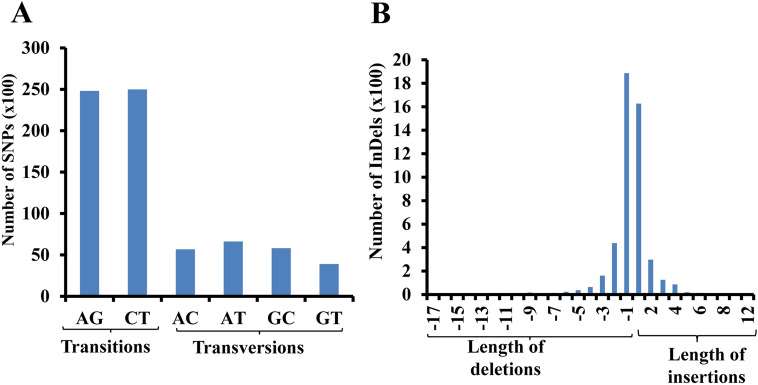
Figure 2.
Frequency of substitution types in SNPs and length distribution of InDels. (A) Number of different substitution types in the identified SNPs showing 100% allelic variations in salt sensitive and salt tolerant rice genotypes. (B) Length distribution of InDels showing 100% allelic variations in salt sensitive and salt tolerant rice genotypes. Number of insertions and deletions (y-axis) of various lengths (x-axis, in bp) are shown in bar graphs.

