
Figure 3.
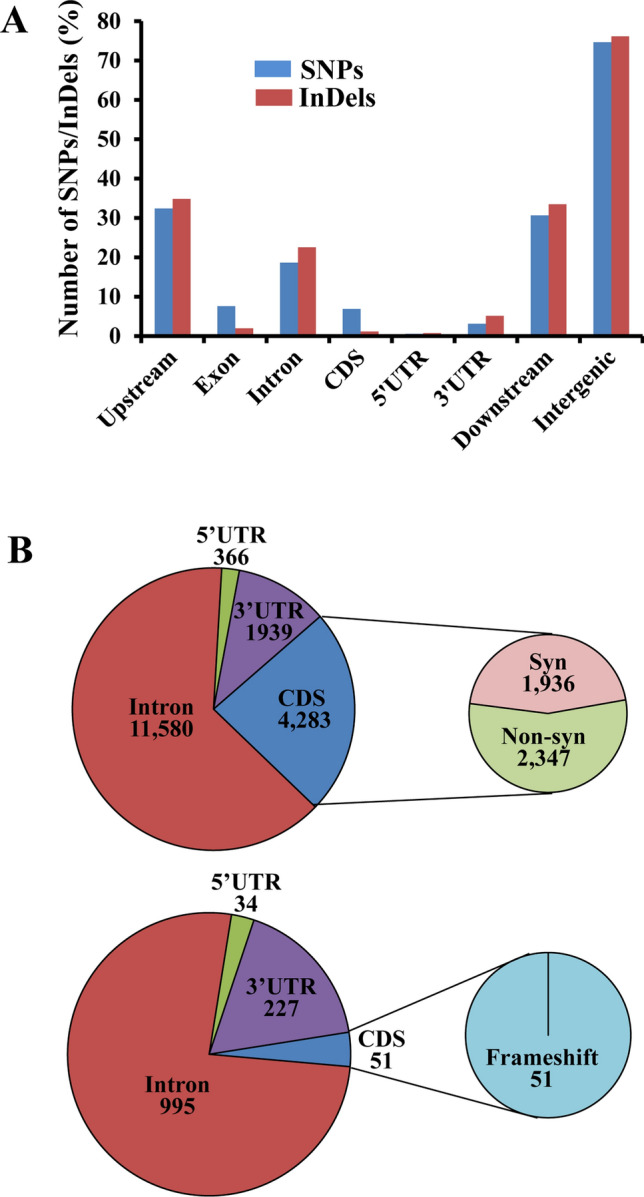
Annotation of SNPs and InDels showing 100% allelic variations in salt sensitive and salt tolerant rice genotypes. (A) Distribution of SNPs and InDels in different genomic regions. (B) Distribution of SNPs and InDels in different genic regions. The number of synonymous (syn) and nonsynonymous (non-syn) SNPs and number of frameshift mutations detected within the CDS regions were shown for SNPs (top) and InDels (bottom), respectively.