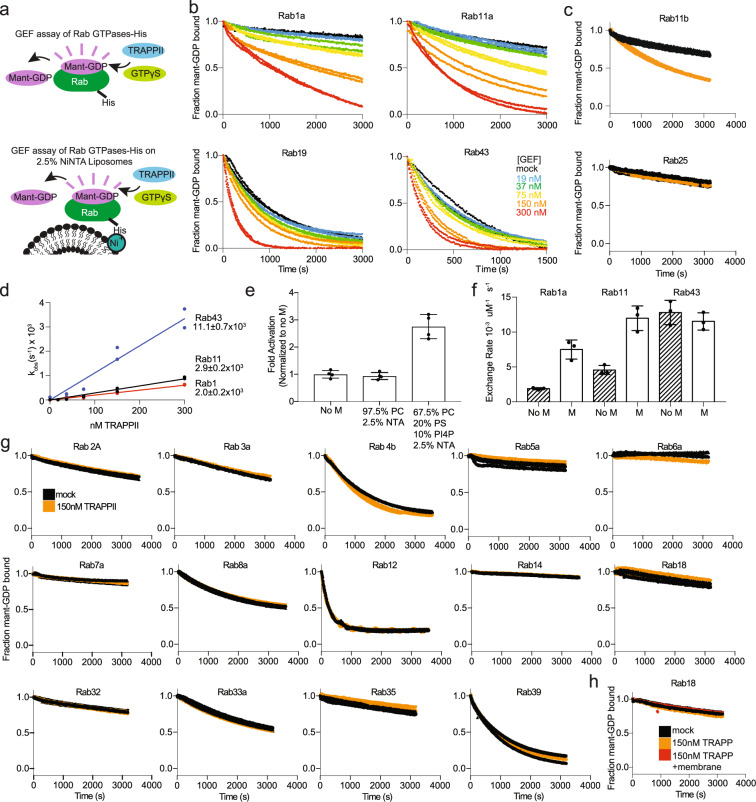
Fig. 2. In vitro GEF assays reveal that TRAPPII is a potent GEF for Rab1, Rab11, Rab19, and Rab43.
a Cartoon Schematic of GEF activation assays using fluorescent analog Mant-GDP in the presence and absence of NiNTA-containing lipid vesicles. b In vitro GEF assay of TRAPPII on Rab1a, Rab11a, Rab19, and Rab43. Nucleotide exchange was monitored by measuring the fluorescent signal during the TRAPPII (19–300 nM) catalyzed release of Mant-GDP from 4 µM of Rab-His6 in the presence of 100 µM GTPγS. Each concentration was conducted in duplicate (n = 2). c In vitro GEF assay of TRAPPII on Rab11b and Rab25(Rab11c). Nucleotide exchange was monitored by measuring the fluorescent signal during the TRAPPII (150 nM) catalyzed release of Mant-GDP from 4 µM of Rab-His6 in the presence of 100 µM GTPγS. Error bars represent SD (n = 3). d Nucleotide exchange rates of Rab1, Rab11, and Rab43 plotted as a function of TRAPPII concentration. The kcat/Km values for all Rabs were calculated from the slope (n = 2). e Bar graph representing the difference in Rab11 GEF activity in the presence and absence of two different 400 nm extruded liposomes at 0.2 mg/ml. Nucleotide exchange was monitored by measuring the fluorescent signal during the TRAPPII (150 nM)-catalyzed release of Mant-GDP from 4 µM of Rab11-His6 in the presence of 100 µM GTPγS. Error bars show SD (n = 4). f Bar graph representing the difference in GEF activation of Rab1, Rab11, and Rab43 in the presence and absence of 400 nm extruded liposomes at 0.2 mg/ml (67.5% PC, 20% PS, 10% PI(4)P, 2.5% DGS NTA). Error bars show SD (n = 3). g In vitro GEF assays of TRAPPII against a panel of 14 Rab GTPases loaded with Mant-GDP with 150 nM TRAPPII and 4 µM Rab GTPase (n = 2–3). h In vitro GEF assay of 4 µM Rab18 loaded with Mant-GDP with 150 nM TRAPPII in the presence or absence of 400 nm extruded liposomes at 0.2 mg/ml (67.5% PC, 20% PS, 10% PI(4)P, 2.5% DGS NTA) (n = 3).

