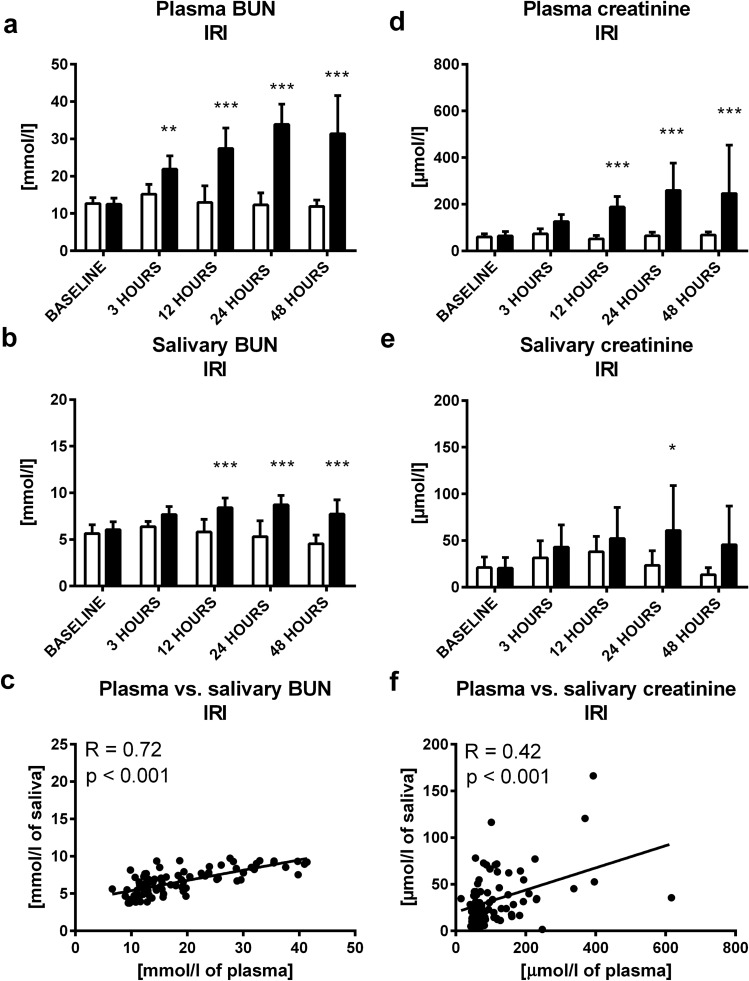
Figure 2.
Concentration of urea in IRI or sham group in (A) plasma, (B) saliva at baseline, 3, 12, 24 and 48 h after ischemia–reperfusion injury, (C) correlation between plasma urea and its salivary concentrations. Concentrations of creatinine in IRI or sham group in (D) plasma, (E) saliva at baseline, 3, 12, 24 and 48 h after ischemia–reperfusion injury, (F) correlation between plasma creatinine and its salivary concentrations. Sham group is shown as white bars and IRI group as black bars. Results are expressed as mean + SD. * denotes p˂0.05, ** denotes p˂0.01, *** denotes p ˂ 0.001 in comparison to the sham group (n = 11 for IRI group, n = 9 for control group).

