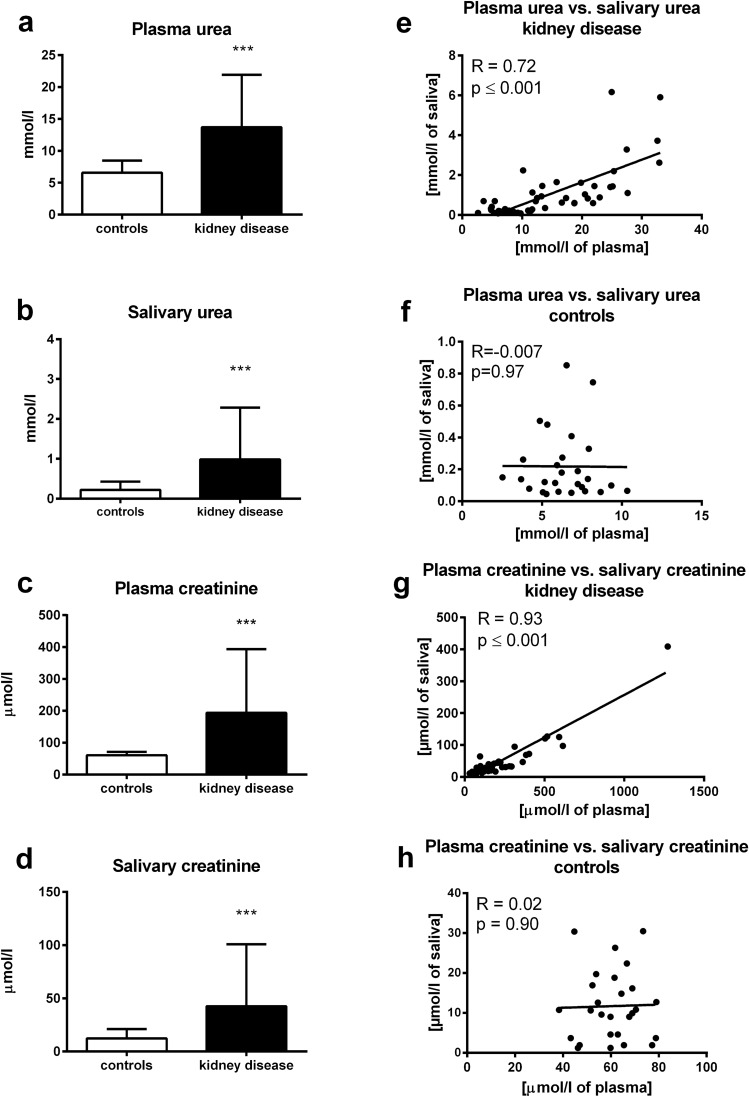
Figure 5.
Concentrations of urea in children with kidney disease or healthy controls in (A) plasma, (B) saliva. Concentrations of creatinine in children with kidney disease or healthy controls in (C) plasma, (D) saliva. Correlations between plasma urea and its salivary concentrations in (E) children with kidney disease, (F) healthy controls. Correlations between plasma creatinine and its salivary concentrations in (G) children with kidney disease, (H) healthy controls. Results are expressed as mean + SD. *** denotes p ˂ 0.001 in comparison to healthy controls (n = 35 for children with kidney disease, n = 29 for healthy controls).

