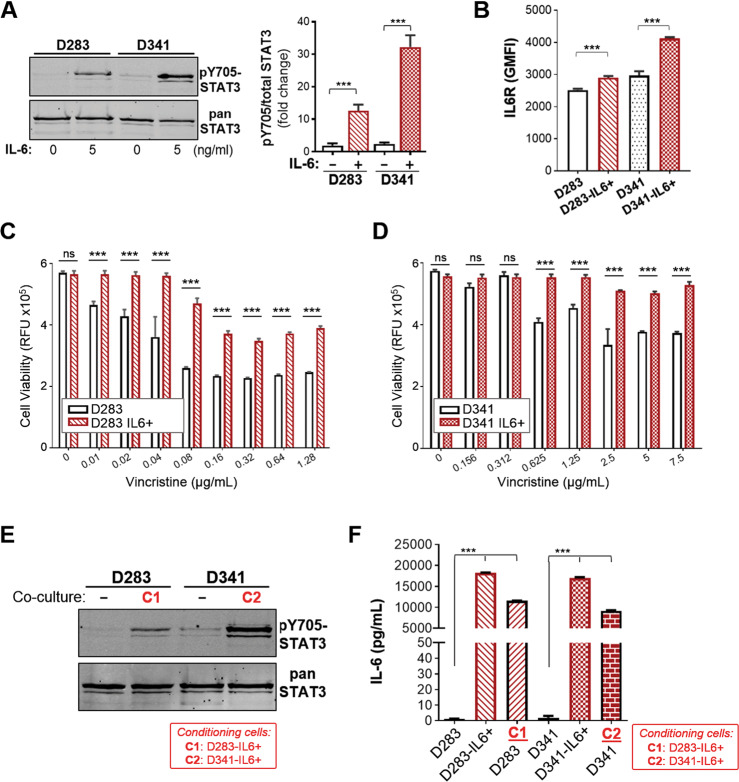
Fig. 7. Group 3 MB cell lines D283 and D341 exhibit similar responses to IL6/STAT3 signaling.
a D283 and D341 MB cells were treated with IL-6 at 5 ng/mL for 10 min and cell lysates immunoblotted for pY705 and total STAT3. Left panel: Representative blot of 3 independent replicates. Right panel: Quantitation of pY705-STAT3 over total STAT3 (mean ± SD, n = 3, ***p < 0.001, one-way ANOVA with Bonferroni’s post-test). b Flow cytometry analysis for expression of IL6R for D283 and D341 cells without and with IL-6 conditioning (as per Fig. 4a). As plotted is the GMFI mean ± SD of an experiment performed in triplicates, and representative of 3 independent experiments (***p < 0.001, one-way ANOVA with Bonferroni’s post-test). Cell viability assay to assess the sensitivity of (c) D283 and D283-IL6+ and, (d) D341 and D341-IL6+ cells to vincristine. As plotted is the mean ± SD of an experiment performed in triplicates, representative of 2 independent experiments (***p < 0.001), one-way ANOVA with Bonferroni’s multiple comparison test. e Western blot analysis for pY705 and total STAT3 levels of D283 and D341 cells without (−) or with coculture treatment with D283-IL6+ (C1) or D341-IL6+ (C2) cells, respectively. f Secreted IL-6 analysis of conditioned media from D283 or D341 cells, their IL-6 conditioned derivatives, and upon coculture with D283-IL6+ (C1) or D341-IL6+ (C2) cells. Plotted is mean ± SD of triplicate experiments; ***p < 0.001, two-way ANOVA with Dunnett’s multiple comparison test.

