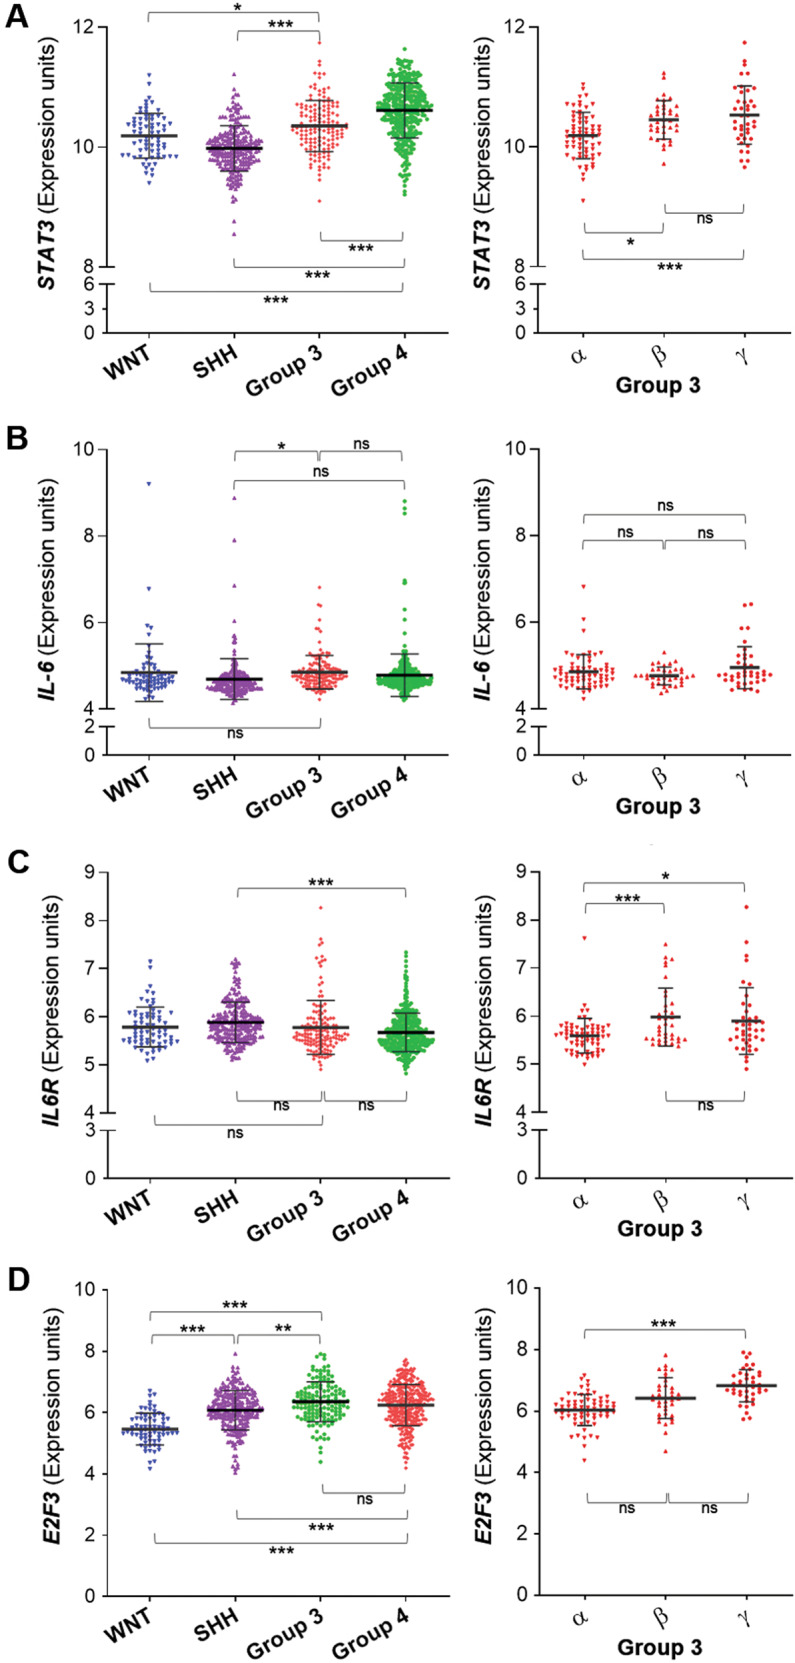
Fig. 8. Expression profiling of STAT3, IL-6 and IL6R in subgroups of MB.

The GSE85217 gene expression database comprises a cohort of 763 primary MB samples categorized into the 4 major subgroups WNT, SHH, Group 4 and Group 3. Group 3 is further subcategorized into 3α, 3β, and 3γ subtypes for the purposes of this analysis. Expression of (a) STAT3, (b) IL-6, (c) IL6R and (d) E2F3 was analyzed according to their subgroup and subtype categorization. ***p < 0.001, **<0.01, *<0.05, one-way ANOVA with Tukey’s post-test.
