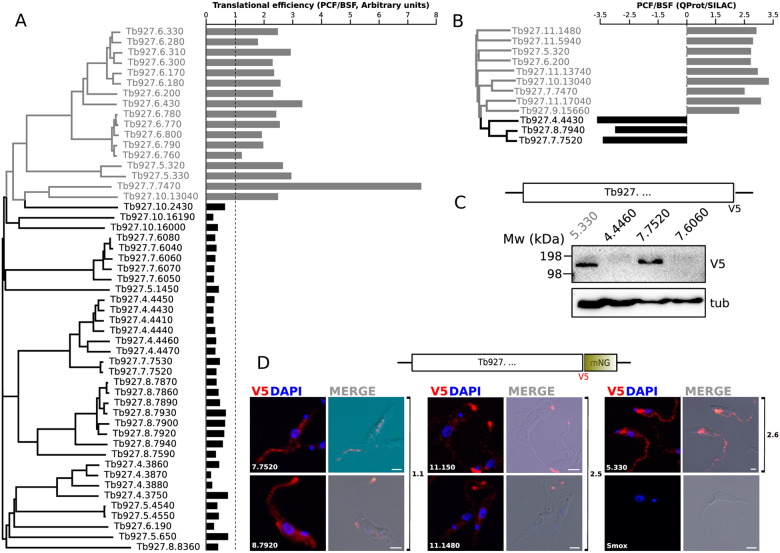
Fig. 3.
In silico and in vivo analysis of selected RACs expression data. (A) Paired comparison between the clustering of RACs and riboprofiling data reported in Vasquez et al. (2014). The relative translational efficiency expressed as PCF/BSF ratio is plotted for each RAC. The base line of value 1 (equally translated RNAs) is indicated as a dotted line. Gray: PCF upregulated, black: BSF upregulated. (B) Relative abundance ratio (PCF/BSF) from quantitative proteomic data in SILAC experiments reported in Urbaniak et al. (2012). Gray: PCF upregulated, black: BSF upregulated. (C) WB determination of V5 C-terminally tagged RAC expression. Total lysates of T. brucei procyclic cells were separated by SDS-PAGE electrophoresis and transferred to PVDF membranes probed with mouse α-V5 antibody and monoclonal mouse α-tubulin as loading control. Molecular weights (kDa) are indicated at the left of the membrane. (D) Tagging and endogenous expression analysis of selected RACs. IFA analysis of the subcellular localization of endogenously V5::mNeonGreen tagged RACs. The data suggest the localization of RACs 11.150, 11.1480, and 8.7920 to the flagellar tip, but RACs 5.330, 7.7520 appear to be localized to the flagellar body and the cytoplasm. Parental SmOx cells are shown as a negative control. White bars: 2 µm.

