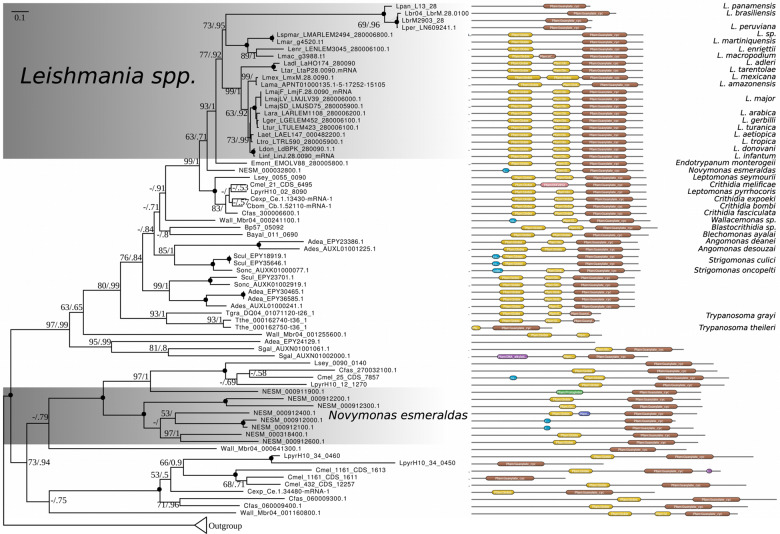
Fig. 4.
Phylogenetic analysis of OACs in trypanosomatids. Maximum-likelihood phylogenetic tree of trypanosomatid OACs with nodes exhibiting maximal bootstrap support and posterior probability (inferred using PhyloBayes MPI) marked by black circles. Numbers at the nodes represent bootstrap supports/posterior probabilities. Scale bar on top left depicts number of substitutions per site. Domain structures for the protein sequences are depicted on the right. The length of the black line in each case is proportional to protein length; globin and AC domains are shown in yellow and brown, respectively. Other less significant domains (DUF and DNA alkylation) are also shown. Outgroup contains AC sequences closely related to OACs and, thus, retrieved by our searches, and yet lacking globin domain.

