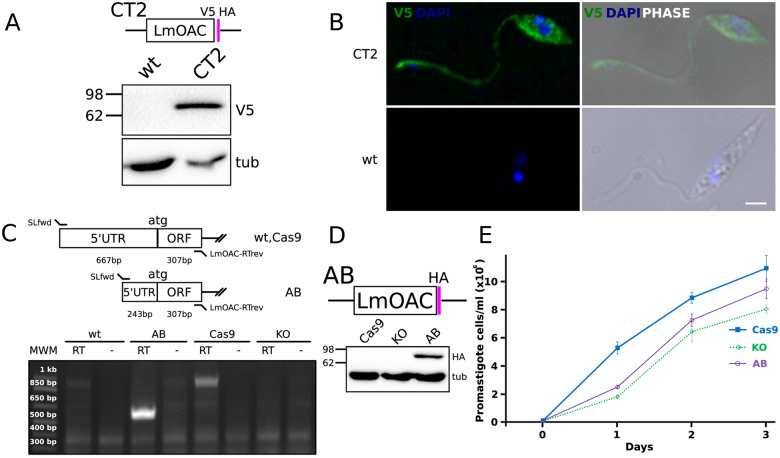
Fig. 5.
Characterization of OAC in L. mexicana. (A) WB analysis of the expression of C-terminally tagged V5-HA LmOAC CT2 cell line. Molecular weights are indicated at the left of membranes. Tubulin signal is shown as loading control. (B) Cytoplasmic and flagellar localization of V5-tagged LmOAC expression assessed by IFA analysis of CT2 L. mexicana promastigotes. White bar: 2 µm. (C) RT-PCR validation of Cas9, KO, and AB strains. PCR products obtained over RT+ and RT− (negative control) reactions performed over total RNA polyA+ of L. mexicana Cas9, KO, and AB strains are shown. An analysis figure is included in the upper panel. Product sizes (bp) are indicated over the molecular weight marker (MWM) on the left. (D) WB assessment of the expression of HA-tagged LmOAC in the AB cell line. Total lysates of Cas9, KO, and AB were probed with mouse α-HA monoclonal antibody. Tubulin expression is shown as loading control. (E) Standard growth curve of Cas9, KO, and AB promastigote cell lines. The total number of parasites (106 cells/ml) versus day of culture in normal conditions is shown.

