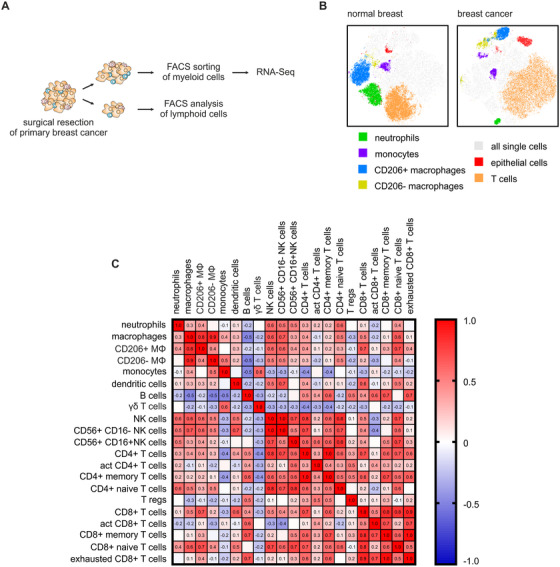
FIGURE 1.

Different macrophage subpopulations in mammary cancer tissue. A, Workflow of mammary tumor tissue analysis. Forty‐eight obtained patient samples were used for FACS sorting and FACS analysis of macrophages and other myeloid cells, while only samples of sufficient size (n = 14) were also used for analyzing lymphoid cell composition. B, tSNE plots of cumulative FACS data from three normal mammary tissues and corresponding breast cancer tissues depicting major cell subsets within all single cells (grey), neutrophils (green), monocytes (violet), CD206+ MΦ (macrophages, blue), CD206− MΦ (yellow), epithelial cells (red), and T cells (orange). C, Correlation matrix of FACS‐analyzed myeloid cells and lymphoid cells. Positive correlation is indicated in red and negative correlation in blue. Numbers indicate Pearson r‐value
