
FIGURE 2.
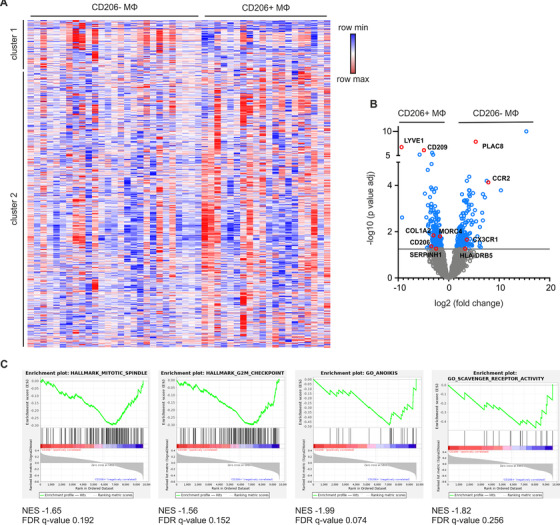
Transcriptome analysis of CD206+ and CD206− macrophages. A, Heat‐map representation of all genes after setting a threshold to eliminate lymphocyte‐related genes (10 076 remaining genes) in CD206− MΦ (n = 27) and CD206+ MΦ (n = 19). Clustering of rows was performed using one minus Pearson correlation. B, Volcano plot of the relative difference in expression level of all genes (n = 10,076). DEGs (453) between CD206− and CD206+ MΦ are marked in blue. Genes of interest for defining macrophage subpopulations are highlighted in red. C, Representative GSEA plots of enriched pathways in CD206+ MΦ when compared to CD206− MΦ. The normalized enrichment score (NES) and false discovery rate (FDR) q‐value are indicated