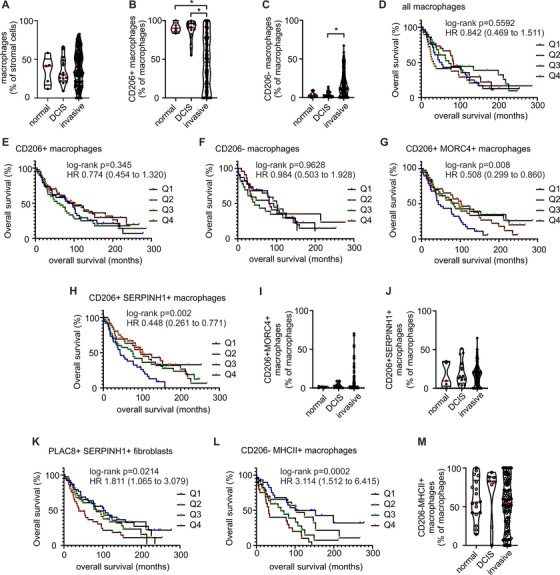
FIGURE 4.

Quantitative analysis of immunofluorescence staining. A‐C, I, J and M, Analysis of TMA staining for the abundance of all macrophages (A) and the CD206+ (B) and CD206− (C) subsets in normal tissue (n = 5), DCIS (n = 16) and invasive breast cancer (n = 154). Abundance of CD206+ MORC4+ (I), CD206+ SERPINH1+ (J), and CD206‐ MHCII+ (M) macrophages was also analyzed in the same tissues. P‐values were calculated using one‐way ANOVA with Dunn's multiple comparison test. *P < .05. D‐H, K, and L, Kaplan‐Meier estimates analyze the association of indicated cell populations with patient survival. Q1 marks the lowest quartile of indicated cell subtype abundance in tissues and Q4 the highest quartile (n = 38 in each quartile for D‐G, H, and K; n = 24 for L). Hazard ratios were calculated between Q1 and Q4
