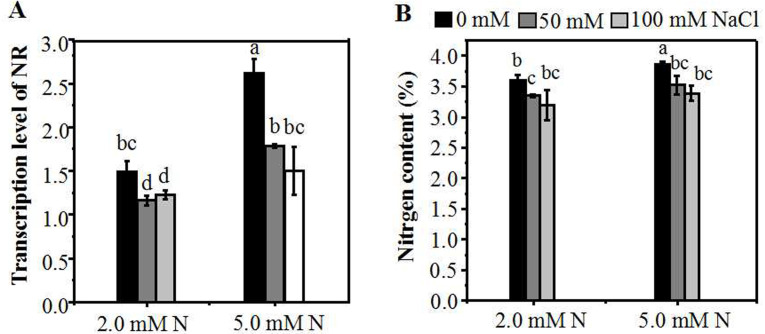
Figure 5. Relative expression of N metabolism-related genes and nitrogen content of leaves grown under different conditions.
(A) NR expression in the leaves of annual ryegrass grown under different nitrogen concentration (2.0, 5.0 mM) exposed to different salt stress for 12 hours (0, 50, 100 mM NaCl) respectively; (B) Nitrogen content of leaves grown with different nitrogen concentrations exposed to different salt stress for 10 days respectively. Different letters above the columns indicate statistically significant differences at P < 0.05 by Student’s t–test.

