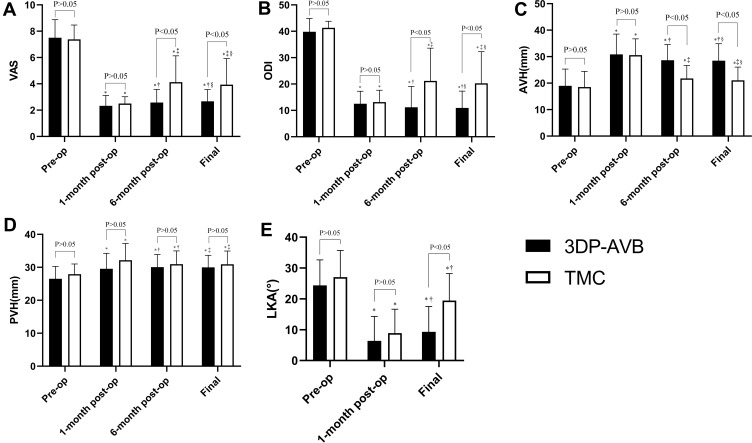
Figure 3.
Clinical and radiographic outcomes. (A–E) *P<0.05 compared with the preoperative data. (A–C) †P>0.05 compared with the 1-month postoperative data, ‡P<0.05 compared with the 1-month postoperative data, §P>0.05 compared with the 6-month postoperative data. (D) †P>0.05 compared with the 1-month postoperative data; ‡P>0.05 compared with the 6-month postoperative data. (E) †P<0.05 compared with the 1-month postoperative data.

