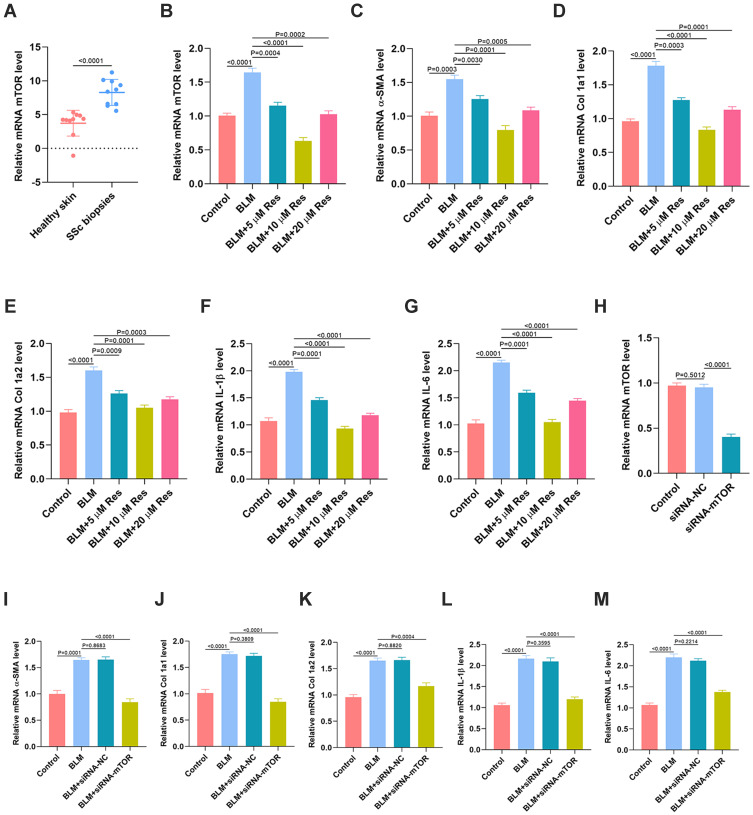
Figure 7.
Res inhibits fibrosis and inflammation through reduction of the expression of mTOR. (A) The expression of mTOR in the skin samples from SSc patients and the normal controls was measured by qRT-PCR analysis, n = 10, per group; (B) The expression of mTOR in HSFs with different treatments was measured by qRT-PCR analysis; (C–E) The expression of fibrotic genes in the different groups was measured by qRT-PCR analysis; (F, G) The expression of inflammatory cytokines IL-1β and IL-6 in the different groups was measured by qRT-PCR analysis; (H) The expression of mTOR in HSFs with different treatments was measured by qRT-PCR analysis; (I–K) The expression of fibrotic genes in the different groups was measured by qRT-PCR analysis; (L, M) The expression of inflammatory cytokines IL-1β and IL-6 in the different groups was measured by qRT-PCR analysis. Data are the means ± SDs of three independent experiments.

