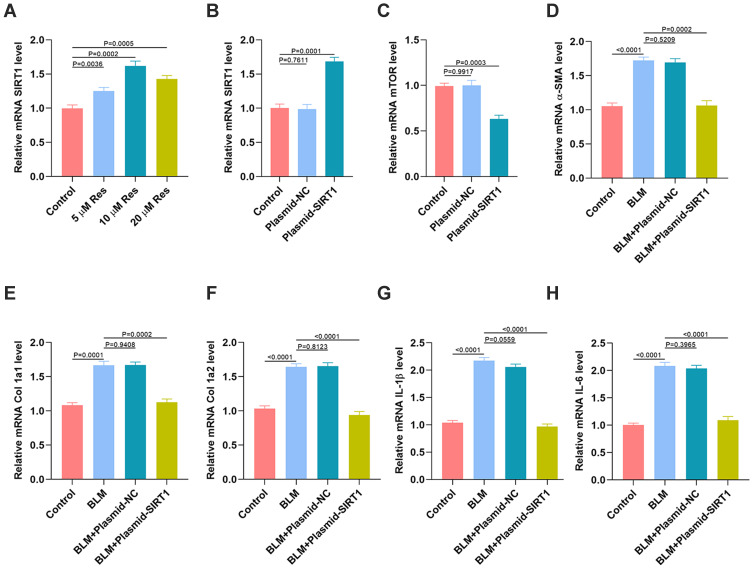
Figure 8.
Res ameliorates SSc via regulation of SIRT1/mTOR signaling. (A) The expression of SIRT1 in HSFs with different treatments was measured by qRT-PCR analysis; (B) The expression of SIRT1 in HSFs after the SIRT1 plasmid inference was measured by qRT-PCR analysis; (C) The expression of mTOR in HSFs after the SIRT1 plasmid inference was measured by qRT-PCR analysis; (D–F) The expression of fibrotic genes in the different groups was measured by qRT-PCR analysis; (G, H) The expression of inflammatory cytokines IL-1β and IL-6 in the different groups was measured by qRT-PCR analysis. Data are the means ± SDs of three independent experiments.

