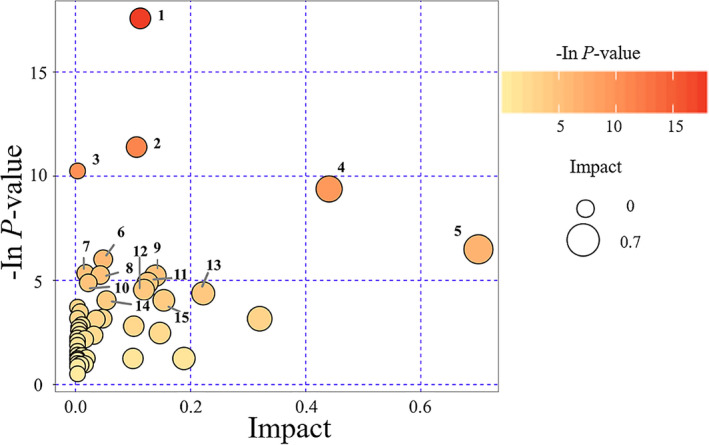
Figure 4.

Pathway analysis of patients with metabolic syndrome (MetS) and healthy controls. The top 15 pathways with major changes (P < 0.05) were identified. Bubble color represents the P value: deeper colors represent smaller P values, indicating larger differences. The size of the bubble represents the impact of the pathway during topological analysis. Larger size represents higher impact.
