Figure 1.

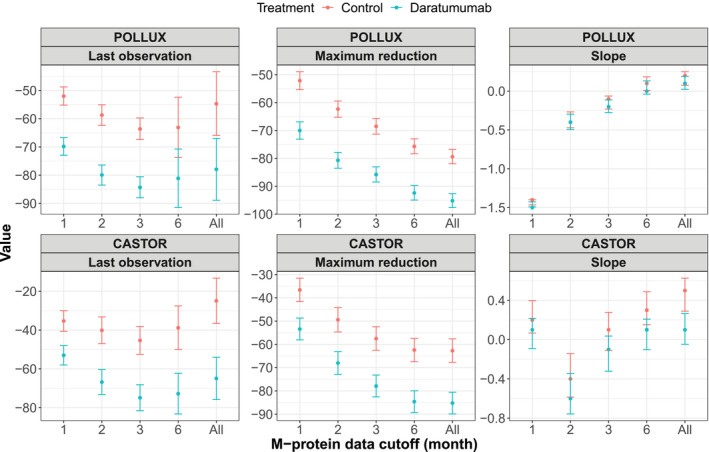
Observed means and 95% confidence intervals of the dynamic features of baseline‐normalized M‐protein data up to different time cutoffs from the POLLUX and CASTOR studies.

Observed means and 95% confidence intervals of the dynamic features of baseline‐normalized M‐protein data up to different time cutoffs from the POLLUX and CASTOR studies.