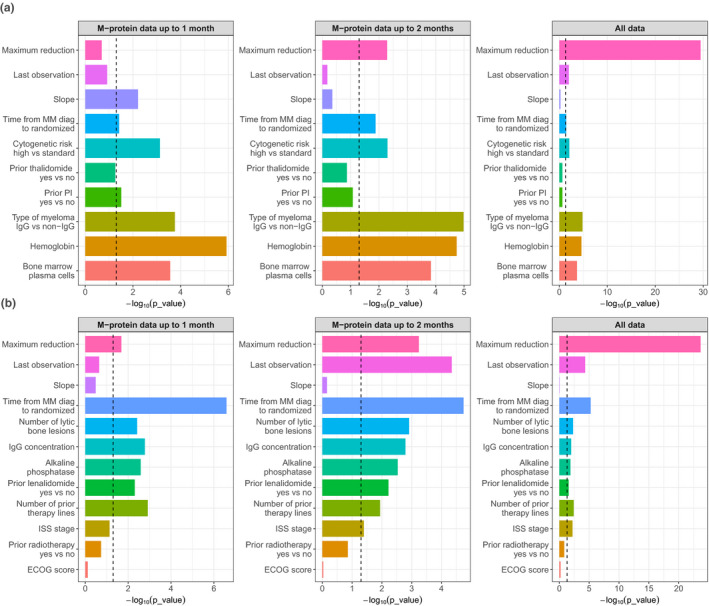
Figure 3.

Statistical significance (‐log10 P) of each variable in a multivariable analysis from the (a) POLLUX and (b) CASTOR studies. The vertical dashed line indicates a P value of 0.05. Maximum reduction = maximum M‐protein reduction (% change from baseline); Last observation = last M‐protein observation (% change from baseline); slope = rate of M‐protein change (%/week). ECOG, Eastern Cooperative Oncology Group; IgG, interleukin G; ISS, International Staging System; MM, multiple myeloma; PI, prior lenalidomide.
