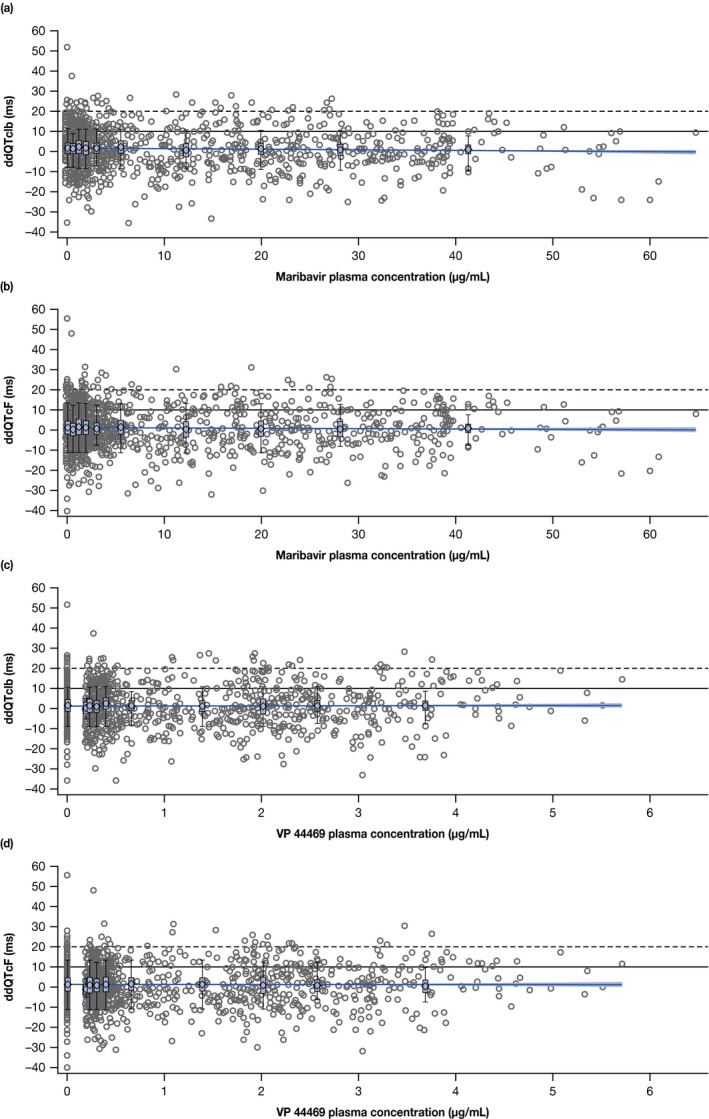
Figure 3.

Relationship between maribavir and metabolite plasma concentration and change in time‐matched, placebo‐corrected, baseline‐adjusted QT interval from the linear mixed‐effects PK–PD model for (a) maribavir and ddQTcIb, (b) maribavir and ddQTcF, (c) VP 44469 and ddQTcIb, and (d) VP 44469 and ddQTcF. The solid line with shaded area represents the PK–PD model‐predicted mean change in ddQTcIb or ddQTcF and the 90% confidence interval as a function of maribavir or VP 44469 plasma concentration. Dashed horizontal lines are reference lines depicting 10 ms and 20 ms of ddQTc change. Box plots display the distribution of predicted ddQTcIb or ddQTcF at each concentration decile. Circles represent individual data points from pooled data from 100‐mg and 1,200‐mg maribavir dose cohorts. ddQTcF, time‐matched, placebo‐corrected, baseline‐adjusted Fridericia‐corrected QT interval; ddQTcIb, time‐matched, placebo‐corrected, baseline‐adjusted individualized corrected QT interval; PD, pharmacodynamic; PK, pharmacokinetic.
