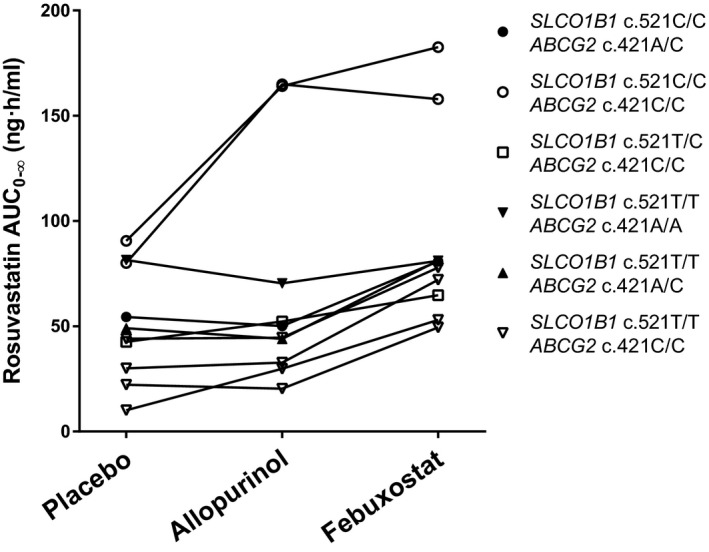
Figure 3.

The individual rosuvastatin area under the plasma concentration‐time curve from zero to infinity (AUC0–∞) values in healthy volunteers after the administration of 10 mg rosuvastatin in a crossover study during placebo, allopurinol, and febuxostat phases.
