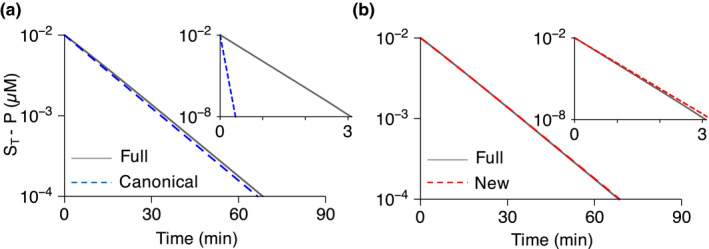
Figure 1.

Simulated propafenone metabolism under in vitro (CYP2D6 = 0.0017 µM) and in vivo (CYP2D6 = 0.95 µM) conditions. (a) The canonical model (Eq. 4) accurately simulates propafenone metabolism under the in vitro condition, but not the in vivo condition (inset). Here, represents the initial drug concentration. For the simulations, pmol∙min−1∙pmol−1 CYP and are used based on the experimental measurement (Table 1 and S1 ). 22 and are used for in vitro and in vivo simulations, respectively (Table 1 ). and min−1 are used for the full model (Eq. 8 in Supplementary Note ) simulation so that . µM, and . (b) The new model (Eq. 6) accurately simulates the drug metabolism under both in vitro and in vivo conditions (inset). K M, Michaelis‐Menten constant; V max, maximal rate of metabolism.
