Figure 3.

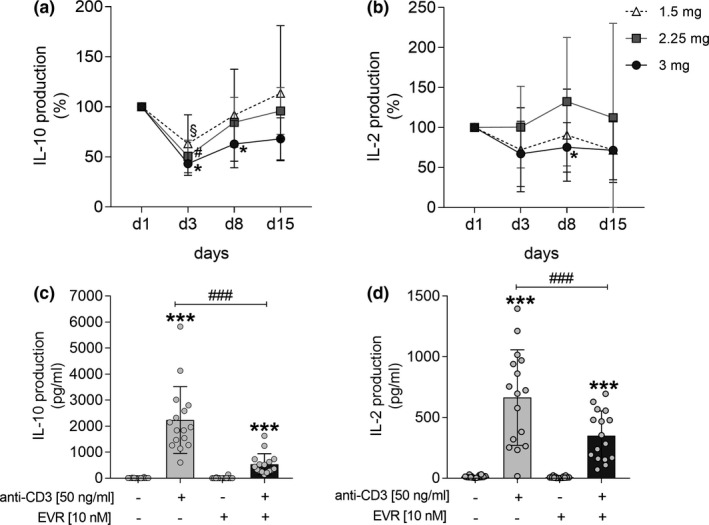
Effect of EVR on cytokine secretion from mitogen‐stimulated PBMCs. IL‐2 and IL‐10 production levels released by PBMCs that were isolated before (day (D)1) and after (D3, D8, and D15) oral administration of EVR in participants of the low‐dose (1.5 mg), medium‐dose (2.25 mg), and high‐dose (3 mg) groups and treated with anti‐CD3 (50 ng/mL) for 24 hours a, b. IL‐2 and IL‐10 cytokine secretion levels from naive PBMCs isolated on D1 and in vitro stimulated with anti‐CD3 (50 ng/mL) in the presence (+) and absence (−) of EVR (10 nM) for 24 hours (c, d). Data are represented as mean ± SD. Differences were analyzed by Wilcoxon test. */# P < 0.05 vs. D1 a, b; **P < 0.01, ***P < 0.001 vs. unstimulated cells, ### P < 0.001 vs. treated cells c, d. EVR, everolimus; PBMC, peripheral blood mononuclear cells.
