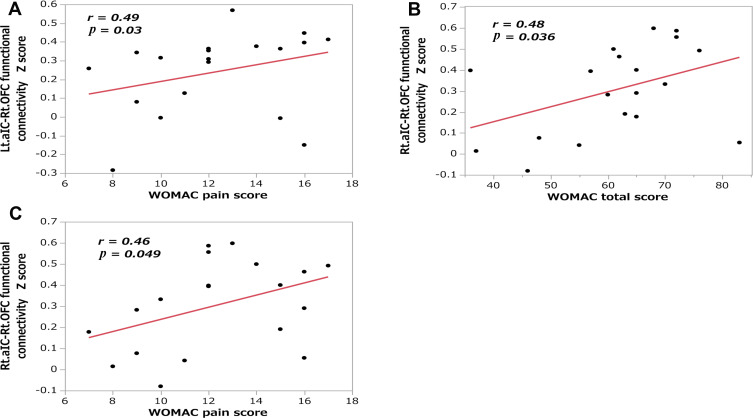
Figure 3.
Correlations between the anterior insular cortex-right orbitofrontal cortex functional connectivity and clinical measurements. Scatter plots showing the correlations of functional connectivity with the (A) WOMAC pain score in the Lt. aIC and Rt. OFC; (B) WOMAC total score in the Rt. aIC and Rt. OFC; and (C) WOMAC pain score in the Rt. aIC and Rt. OFC.
Abbreviations: aIC, anterior insular cortex; Lt, left; Rt, right; OFC, orbitofrontal cortex; WOMAC, Western Ontario and McMaster Universities Osteoarthritis Index.

