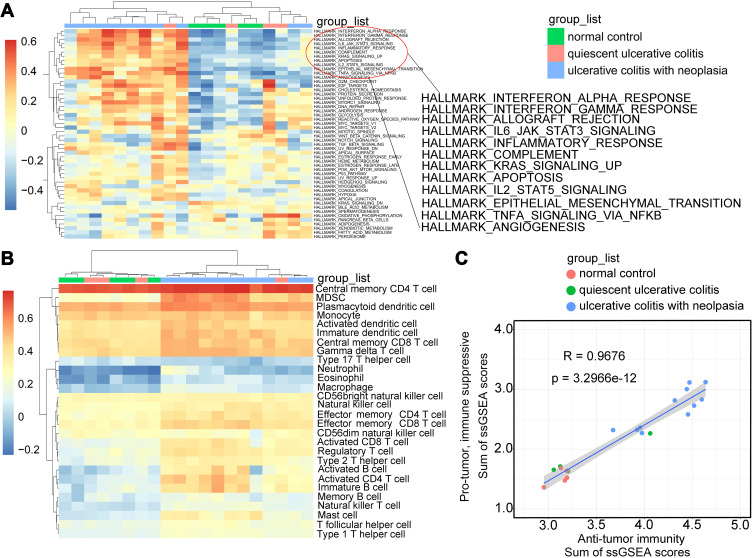
Figure 1.
Heterogeneity of transcriptomic profiles of samples from patients with quiescent ulcerative colitis, ulcerative colitis with neoplasia, and normal control. (A) Heatmap with clusters displaying the results of GSVA on the Hallmark gene set among the three groups. (B) The heterogeneity of immune cell types for the three groups calculated by ssGSEA. (C) The correlation of immune cell populations of the three groups between anti-tumor clusters (ActCD4, ActCD8, TcmCD4, TcmCD8, TemCD4, TemCD8, Th1, Th17, ActDC, CD56briNK, NK, NKT) and pro-tumor clusters by suppressing the immune system (Treg, Th2, CD56dimNK, imDC, TAM, MDSC, Neutrophil, and pDC). R and the gray shaded area represent the coefficient of correlation and 95% CI, respectively.
Abbreviations: GSVA, Gene set variation analysis; ssGSEA, single-sample gene set enrichment analysis; ActCD4, activated CD4 T cell; TcmCD4, central memory CD4 T cell; TemCD4, effector memory CD4 T cell; DC, dendritic cell; CD56birNK, CD56 bright natural kill cell; NK, natural kill cell; NKT, natural kill T cell; TAM, tumor-associated macrophage; MDSC, myeloid-derived suppressor cells; pDC, plasmacytoid dendritic cell; CI, confident interval.

