Figure 3.
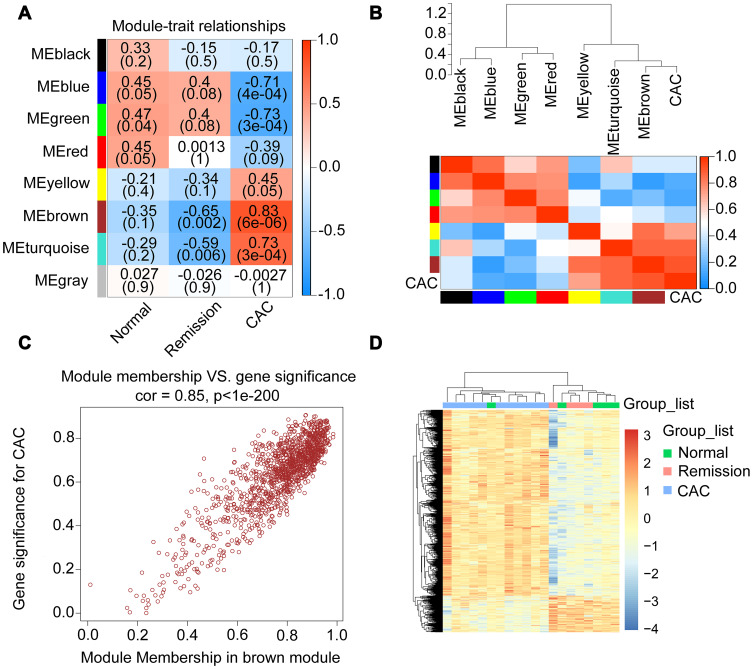
Correlated genes in the interested modules of CAC identified by WGCNA. (A) Heatmap depicting the strength of relationships between each module and the clinical features. The ρ coefficients as well as corresponding p values were exhibited in various shade of colors. The positive correlation was exhibited in red and the negative was in blue. (B) The dendrogram (top) and heatmap (bottom) displaying the strength of correlations between CAC and other modules in which the red represented a higher positive adjacency and the blue represented a lower one. (C) The scatterplot of the correlation between gene significance (y-axis) and the selected module (brown) membership for CAC. In this brown module, genes were highly correlated with both the selected module and the clinical feature of CAC. (D) Heatmap with clusters of differentially expressed genes in brown module among the 3 different groups.
Abbreviations: CAC, ulcerative colitis-associated colorectal cancer; WGCNA, weighted correlation network analysis.

