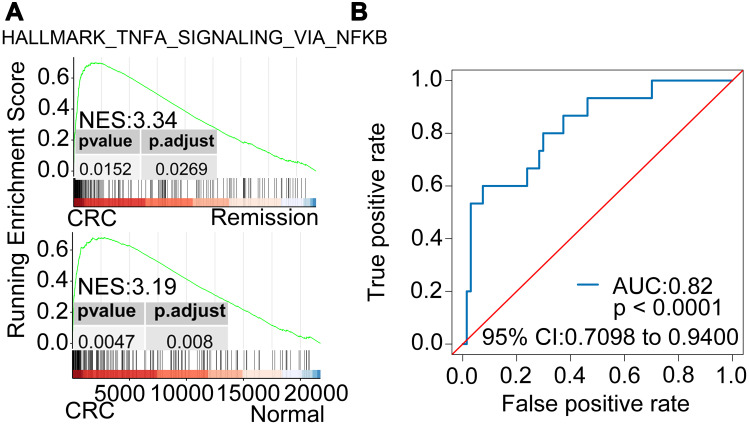
Figure 6.
(A) GSEA plots depicting the TNF signaling via NF-κB pathway which was positively enriched in CRC patients in our validation cohort compared with patients with UC in remission (top) and normal patients (bottom). (B) The ROC curve with AUC at 0.82 for the diagnosis value of the 7-NF-κB-signaling-gene signature in detecting UC patients with high risk for CRC (p<0.0001, 95% CI: 0.7098–0.9400).
Abbreviations: GSEA, gene set enrichment analysis; UC, ulcerative colitis; CRC, colorectal cancer; ROC, receiver operating characteristic; AUC, area under curve.

