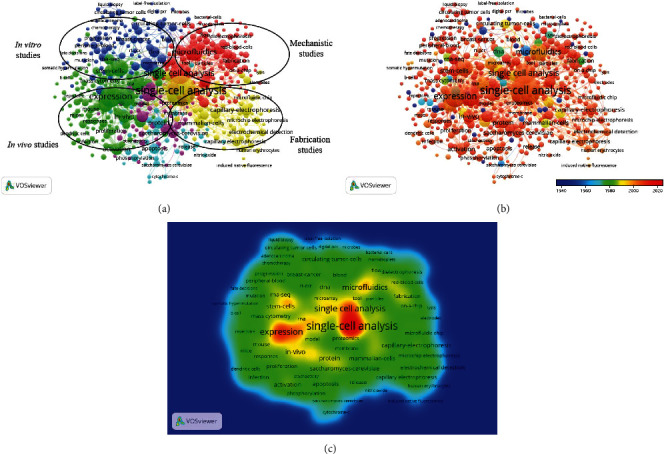
Figure 6.

Co-occurrence analysis of global research on single-cell analysis. (a) Mapping of keywords in the research area. The size of the points represents the frequency of appearance, and the keywords are divided into four clusters: mechanistic studies (red), in vitro studies (blue), in vivo studies (green), and fabrication studies (yellow). (b) Distribution of keywords according to the chronological order of appearance. Keywords in blue appeared earlier than those in yellow and keywords in red appeared the latest. (c) Distribution of keywords according to the mean frequency of appearance. Keywords in red occurred with the highest frequency, followed by yellow, green, and cyan.
