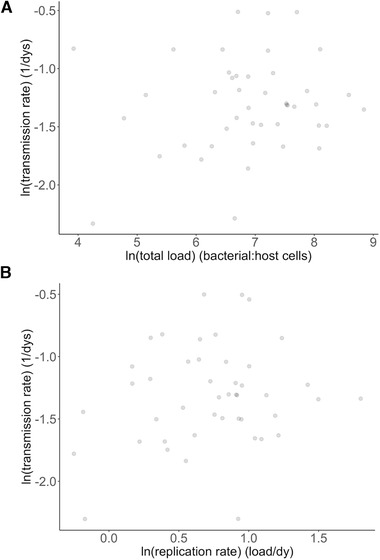
Figure 3.

Association between transmission rate and pathogen load. We show transmission rate (in days−1) as a function of: (A) total pathogen load (ratio of bacterial:host cells) and (B) pathogen replication rate (load. day−1). Points represent jittered raw values.
