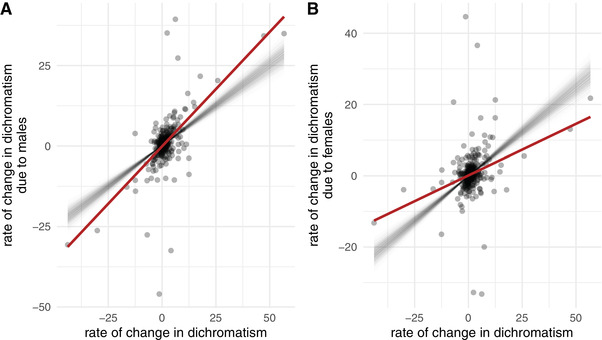
Figure 4.

Changes in dichromatism are more likely to be the result of male change than female change. The x‐axis represents effective rates of change in dichromatism, for each species. The y‐axis shows the male (A) or female (B) attributable parts of that change along the same branch, which is the evolutionary rate of color evolution in the direction of dichromatism (see main text). The red line shows the observed relationship, whereas each thin gray line represents sample from the null distribution of that relationship. The null distribution was obtained by randomly permuting males and females within species along 1000 phylogenies. Note that the results in the two panels are not independent, the slopes necessarily add up to 1.
