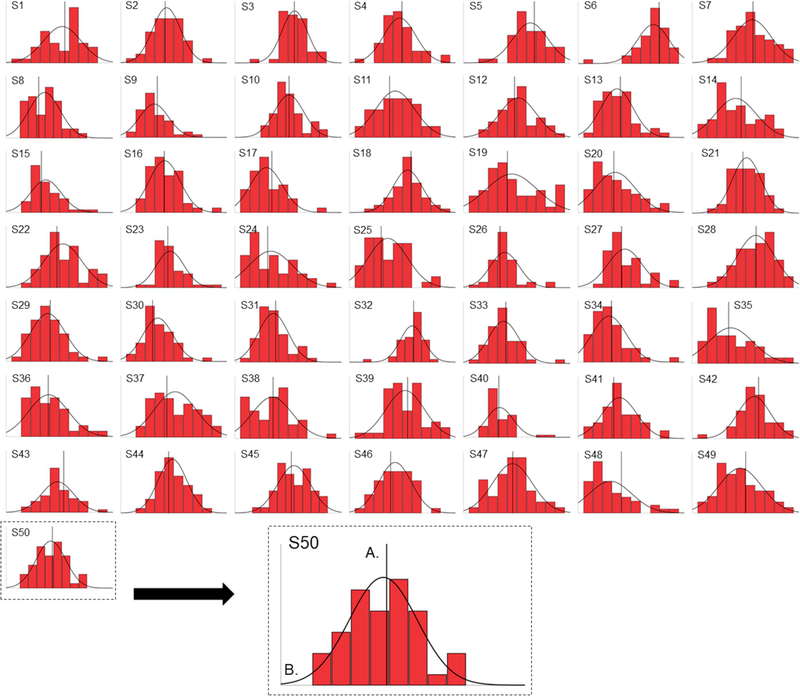
Fig. 4. Subject-Level Distributions of Congruent Reaction Times.
Frequency distributions of congruent reaction times (blue) are plotted separately for each of the 50 subjects included in final analyses (S1 – S50). A). Reference line on the x-axis denotes the unique mean of neutral-neutral trials, which is computed separately for each subject. B). Normal distribution curves are depicted separately based each subject’s unique congruent reaction time distribution. (For interpretation of the references to colour in this figure legend, the reader is referred to the Web version of this article.)

