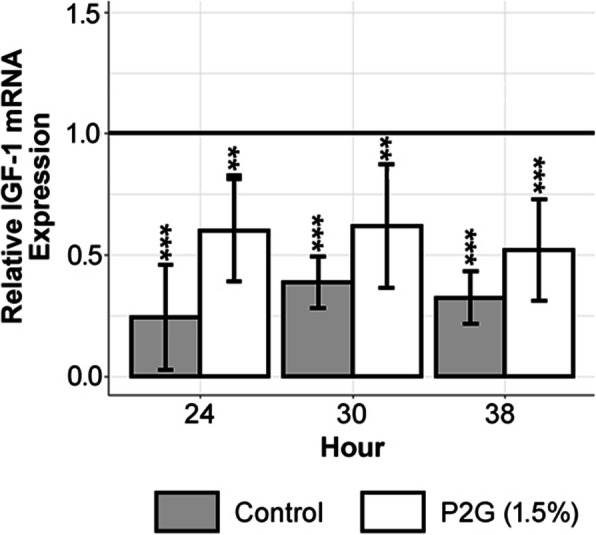
Fig. 2.

Experimental data indicate that preosteoblasts’ mean relative IGF-1 expression at the pre-treatment baseline is higher than either P2G or water treated preosteoblasts’ mean relative IGF-1 expression at each time point (regression with indicator variables). Experimental data indicate that treated preosteoblasts have a higher mean relative IGF-1 expression than water treated controls (fold increase of 1.82, two-way ANOVA that aggregates the three biological replicates from each time point into an overall study arm and as a consequence precisely estimates the standard error). Significance of each group, as shown with asterisks refers to comparison with the hour 0 control. The solid line is the normalized mean of hour 0 pre-treatment baseline measurements. Control refers to study arms treated with water. The graph displays qRT-PCR mRNA expression. NS p > 0.05, * p < 0.05, ** p < 0.01, *** p < 0.001
