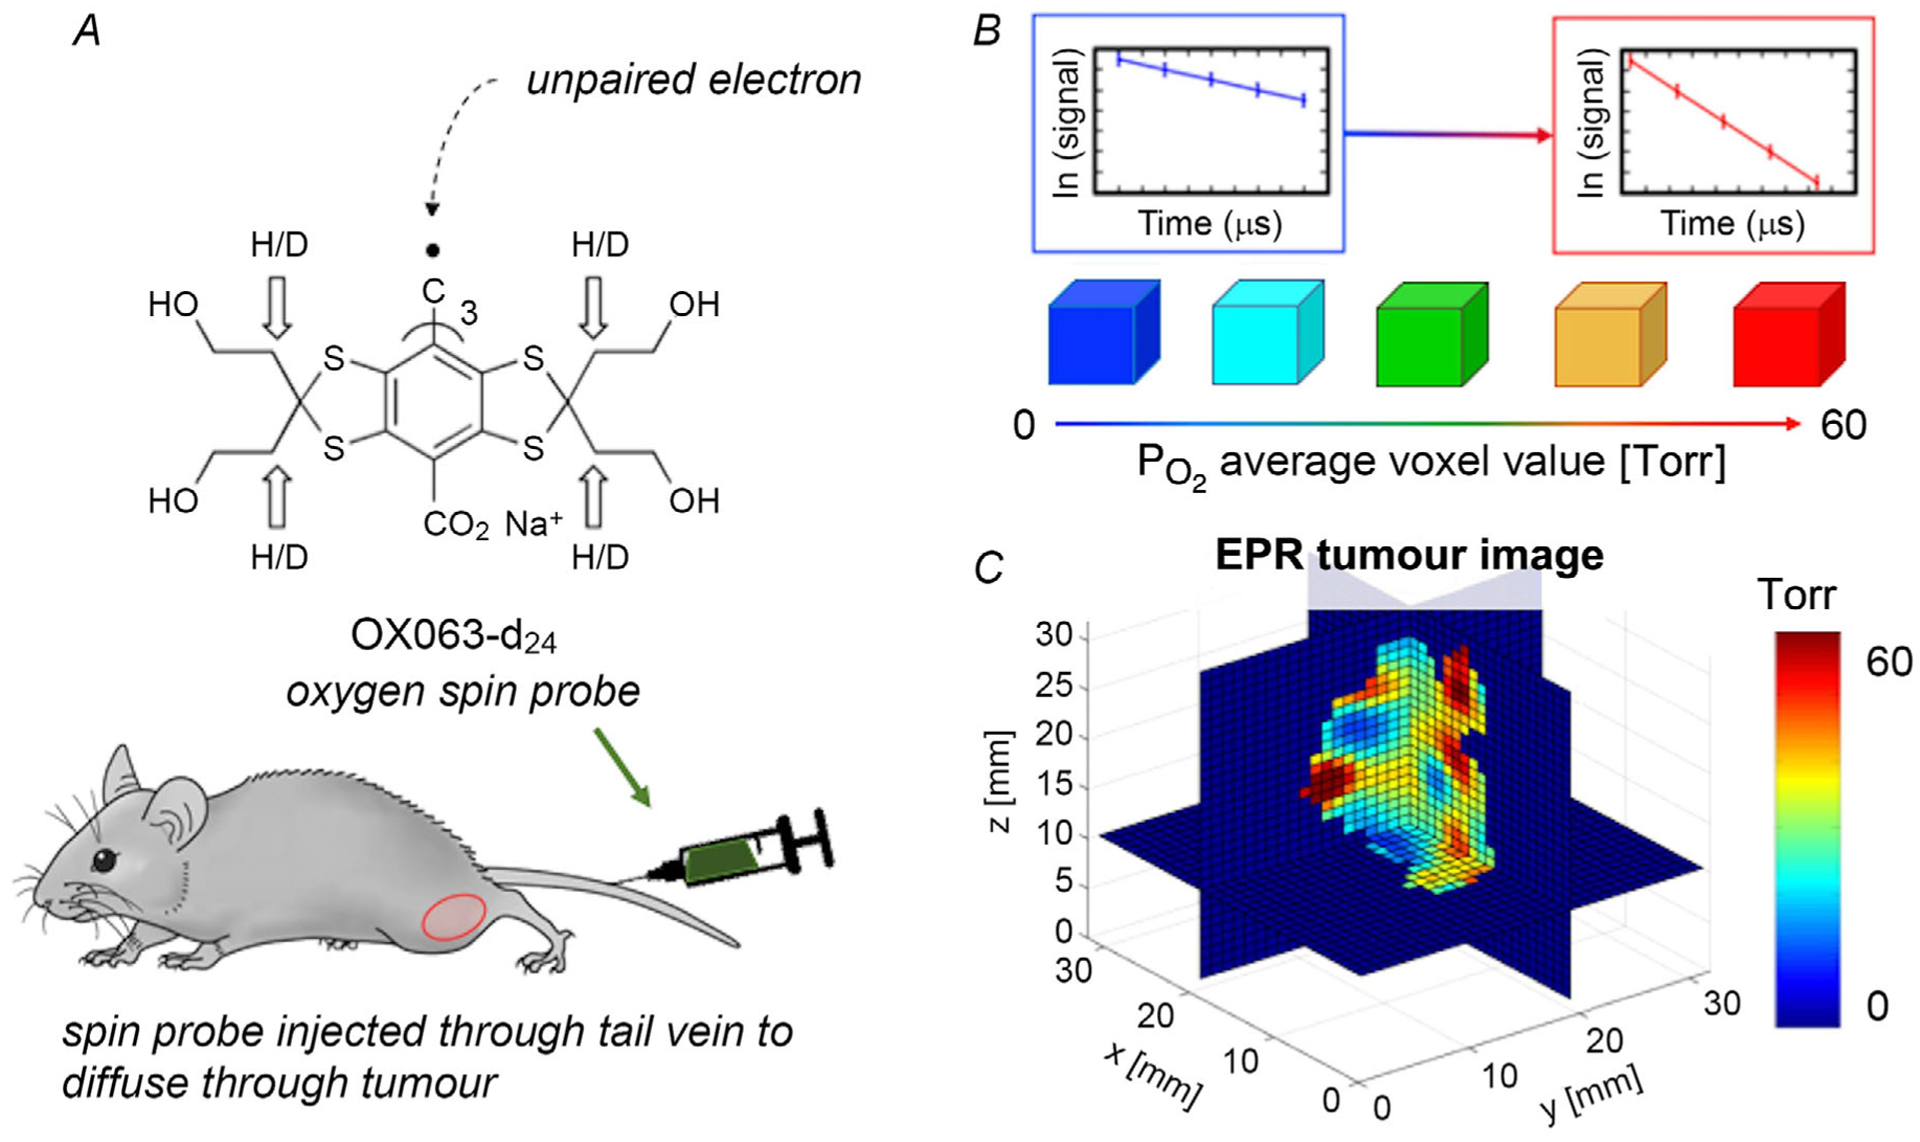
Figure 2. Quantitative imaging with spin lattice relaxation EPR.

A, chemical structure of oxygen spin probe OX063-d24, which is infused into the mouse via tail vein. B, in the EPR spin-lattice relaxation signal, the relaxation rate of the spin probe is higher for high and lower for low . C, tomographic reconstruction shows a 3D quantitative distribution of in the tumour in isotropic voxels of 0.67 × 0.67 × 0.67 mm3, where voxels ≤ 10 Torr show hypoxia (blue).
