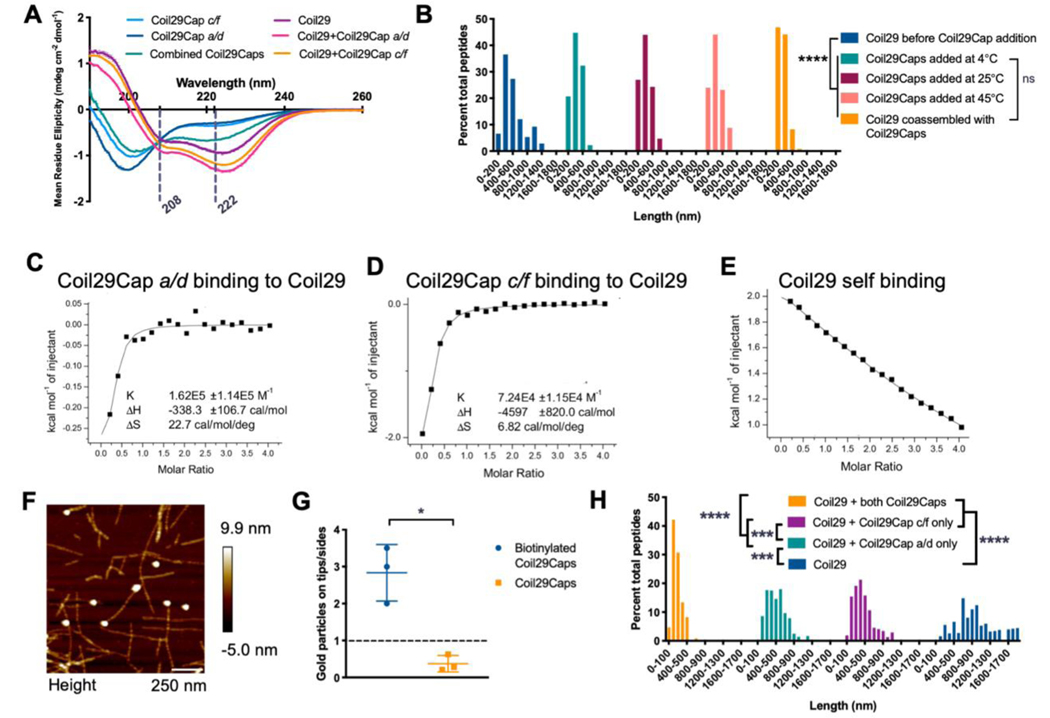
Figure 2. Binding characterization of Coil29Caps and Coil29.
A) CD spectra of Coil29 and Coil29Caps, with dashed lines marking 208 nm and 222 nm. Peptides were prepared at 2 mM in PBS, diluted to 0.1 mM in water immediately prior to scanning. Reported spectra are averaged from 3 scans and error bars indicate standard deviation. (The CD spectra for Coil29Cap a/d and Coil29Cap c/f from Figure 1A are also displayed in Figure 2A for comparison to spectra from a mixture of both Coil29Caps.) B) Length distributions of Coil29 alone, after the addition of equimolar concentration of Coil29Caps, and co-assembled in a 1:10 ratio with Coil29Caps (n=3 images per condition). Nanofiber lengths were compared using the Kruskal-Wallis test with Dunn’s multiple comparisons (****p<0.0001). C-E) Wiseman plots showing changes in sample energy when Coil29Caps or Coil29 was titrated into Coil29, with data from fit equations using a 1 site binding model. F) Representative AFM image showing Coil29Caps labeled with gold nanoparticles. G) Quantification of Coil29Cap location on nanofiber structures compared to background labeling of Capped Coil29 nanofibers without biotin tag (n=3 images per condition). (*p<0.05, unpaired two-tail t test with Welch’s correction). H) Length distributions of nanofibers formed with one or both of Coil29Caps (n=3 images per condition). Nanofiber lengths were compared using the Kruskal-Wallis test with Dunn’s multiple comparisons (***p<0.001, ****p<0.0001).

