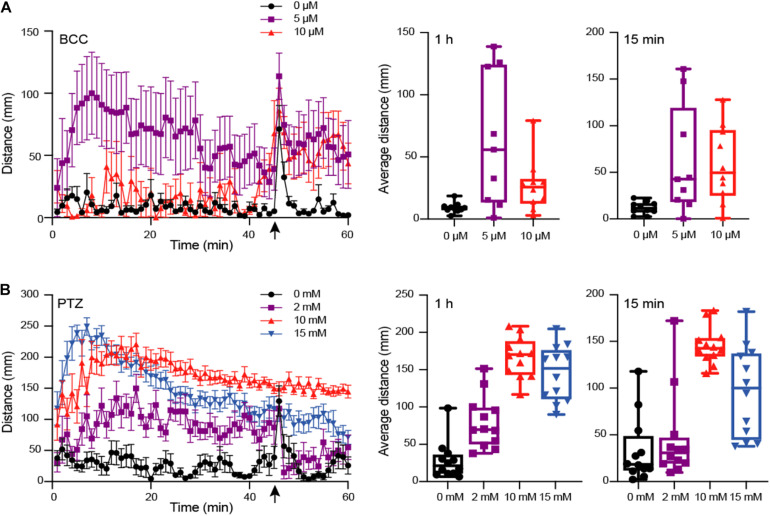
FIGURE 2.
Behavioral phenotype assessment of larvae at 5 dpf using motion tracking. Larvae treated with varied concentrations of GABAA antagonizing drugs (A) Bicuculline (BCC) (0 to 10 μM; n = 10) or (B) Pentylenetetrazol (PTZ) (0 to 15 mM; n = 12), respectively, were tracked using DanioVision and total distance moved per minute measured for 1 h. With 15 min remaining (indicated by an arrow), larvae were subjected to flashing lights for 1 min. The average movement per fish across 60 min and in the last 15 min following flashing lights are indicated as boxplots for each drug concentration. Left plots include the mean distance per minute and with error bars representing standard error of the mean.

