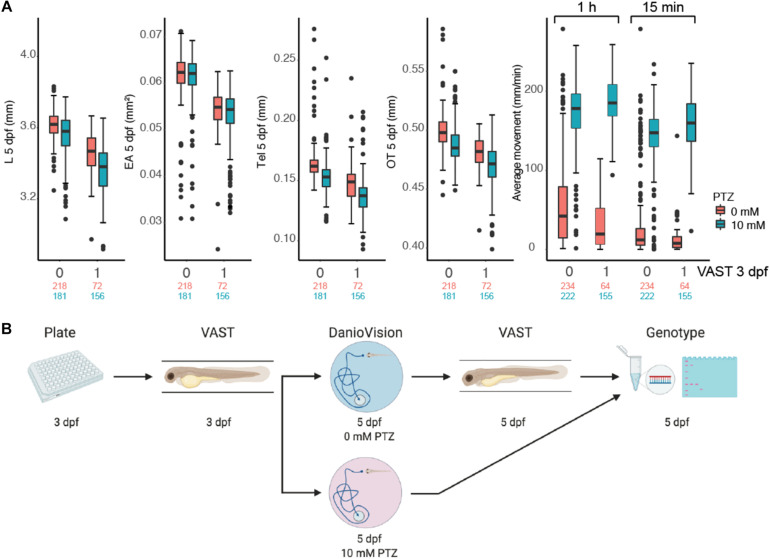
FIGURE 3.
High-throughput zebrafish larvae phenotyping platform. (A) Impact of morphometric (L, EA, Tel, OT) and behavioral (average movement for the entire 1 h and the final 15 min following flashing lights) measurements for 5 dpf larvae for fish not subjected (0) and subjected (1) to VAST measurements at 3 dpf are shown as boxplots. Behavior was also plotted at varied PTZ concentrations (red = 0 mM and blue = 10 mM). Total numbers of measured larvae are indicated beneath plots subjected to 0 mM (red) or 10 mM (blue) PTZ treatment. Boxplots for morphological and behavioral measurements include the median value (dark line), and the whiskers represent a 1.5 interquartile range. (B) The final combinatorial phenotyping platform is pictured, which combines two morphometric measurements (3 and 5 dpf) and behavioral tracking (5 dpf) with 0 mM and 10 mM PTZ, followed by genotyping of larvae.

