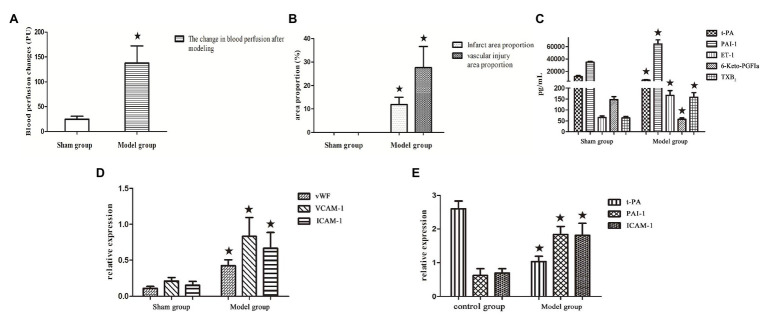
Figure 1.
(A–D) Bar graphs of blood perfusion change, cerebral infarction area, vascular injury area, and endothelial factors. Protein expression in the model group and sham-operated group. (E) Bar graphs of gene expression in the model group and control group without the intervention of shear stress and drugs. All data are expressed as the mean ± SD. Comparisons between the sham group and model group were analyzed using the independent-sample t-test. A value of p < 0.05 was considered statistically significant.

