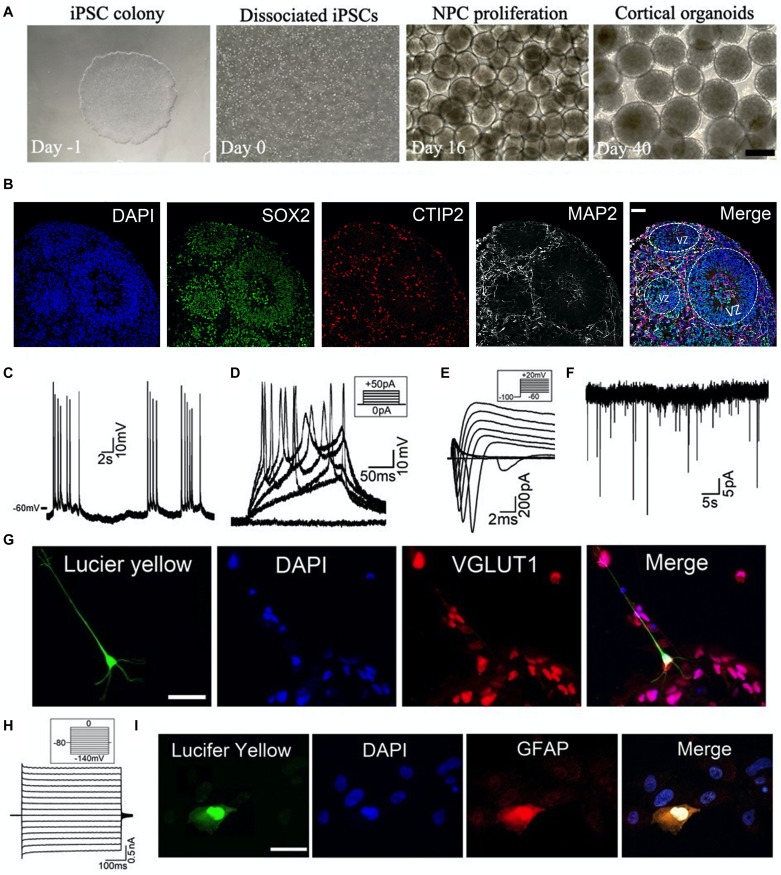
FIGURE 1.
Generation and characterization of human cortical organoids. (A) Schematic of cortical organoid generation from dissociation of iPSCs (day -1, 0) to neural induction (day 16) and then to neural proliferation and maturation (day 40). Scale bar, 500 μm. (B) Typical immunostaining images on cryosections of 2-month-old cortical organoid showing the neural differentiation profile. VZ, ventricular zoon. Scale bar, 50 μm. (C–I) Combining patch-clamp recordings with immunocytochemical staining to define cell types of cortical organoids. (C–F) Whole-cell patch-clamp recordings of (C) spontaneous Action Potential (AP) firing, (D) evoked AP firing, (E) voltage-gated Na+ currents (INa) and K+ currents (IK), and (F) spontaneous excitatory postsynaptic currents (sEPSCs) voltage-clamped at –60 mV, from a representative neuron located at the edge of a 3-month-old organoid in the dish. Recording protocols were shown in the inset. (G) The same neuron was filled with Lucifer yellow (1 mg/ml) during recording (left), and then this organoid was processed for immunocytochemistry with glutamatergic neuron marker VGLUT1. Merged labeling (right) confirmed that the recorded cell was a glutamatergic neuron. Scale bar, 50 μm. (H) Patch-clamp recording of weakly inward rectifying K+ currents (IKir) in a glial cell located at the edge of a 3-month-old organoid. (I) The cell was filled with Lucifer yellow (1 mg/ml) during recording (left), and then this organoid was processed for immunocytochemistry with astrocyte marker GFAP. Merged labeling (right) confirmed that the recorded glial cell was an astrocyte. Scale bar, 50 μm.

