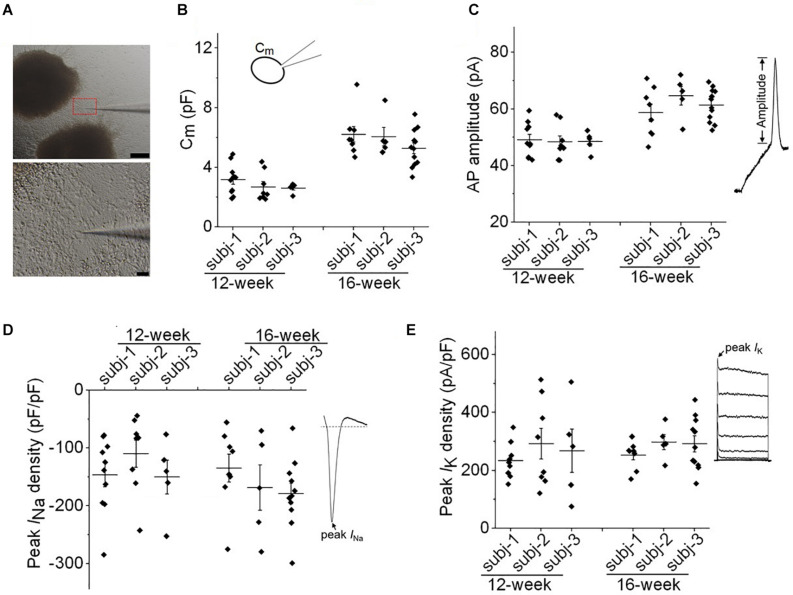
FIGURE 2.
Evaluation of variability in neuronal membrane properties. (A) Representative images of whole-cell patch clamp recording of a neuron at the edge of cortical organoids. Scale bar, 200 μm (upper panel) and 10 μm (lower panel). (B,C) Plots of cell capacitance (Cm), and AP amplitude (evoked by 50 pA) of individual neurons from three healthy subjects (subj-1, subj-2, and subj-3) for 12-week and 16-week old organoids. For both panels, one-way ANOVA, p > 0.99 for comparisons among three subjects at 12-week, or 16-week. n = 5–12 neurons. (D) Plot of peak INa density of individual neurons from three healthy subjects at the age of 12-week and 16-week. One-way ANOVA, p = 0.36. n = 5–11 neurons. (E) Plot of peak IK density of individual neurons. One-way ANOVA, p = 0.73. n = 5–11 neurons. Recording protocols for INa and IK were shown in Figures 5, 6. Graphs display mean and SEM.

