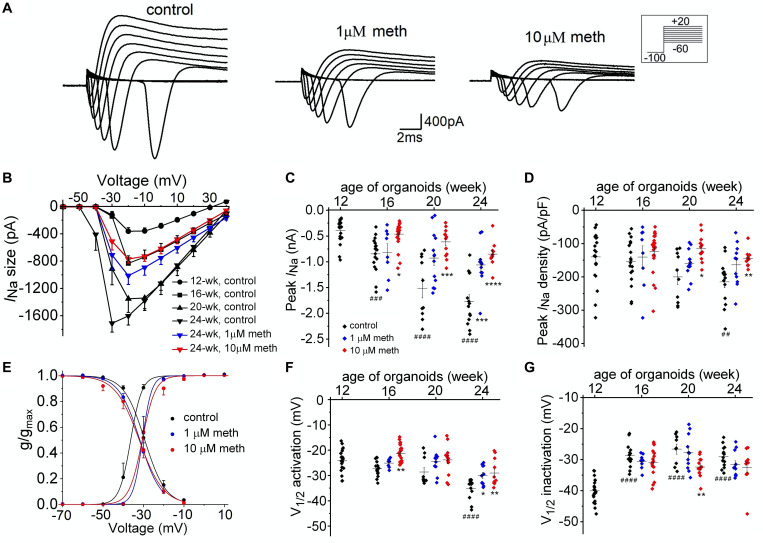
FIGURE 5.
Methadone exposure attenuates the developmental change of Na+ current properties. (A) Na+ current traces recorded from representative neuronsfrom 16-week-old organoids in control and 4-week treatments of 1 μM and 10 μM methadone. (B) Plot of average Na+ current size as a function of voltage determined from neurons at the edge of cortical organoids at indicated ages and methadone treatments. Chronic methadone exposure significantly attenuated the developmental increase of INa size. (C,D) Scatter plot showing the peak INa size (C) and INa density (D) of neurons from human cortical organoids with indicated ages and methadone treatments. (E) Voltage dependence of activation and inactivation curves calculated for Na+ currents recorded from 24-week-old neurons of cortical organoids in control groups and methadone treated groups. The solid lines represent Boltzmann fits to the average data. (F,G) Scatter plot showing voltages at which half of the Na+ channels were activated (F) or inactivated (G) in each group. Graph of scatter plots display mean and SEM. n = 8–24 neurons (6–15 organoids). Two-way ANOVA followed by Tukey’s multiple comparisons test: (C) F(6, 162) = 7.39, p < 0.0001; (D) F(6, 162) = 1.38, p = 0.22; (F) F(6, 162) = 2.23, p < 0.05; (G) F(6, 162) = 1.93, p = 0.06. Control groups at 16-week, 20-week, 24-week were compared to 12-week group, ##p < 0.01, ###p < 0.001, and ####p < 0.0001. Each methadone-treated groups were compared to the control group at the same age, *p < 0.05,**p < 0.01, ***p < 0.001, ****p < 0.0001.

