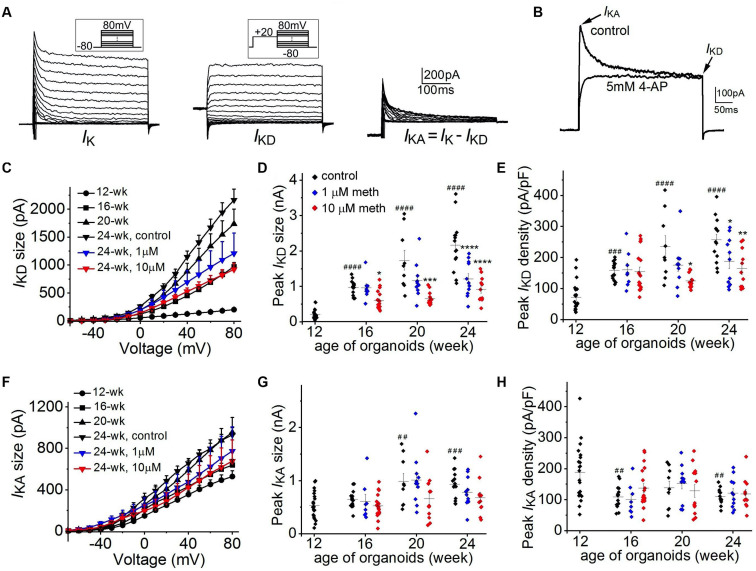
FIGURE 6.
Methadone attenuates the developmental increase of non-inactivating K+ currents. (A) K+ current traces recorded from a representative neuron at the edge of 16-week-old organoids without methadone treatment. Left panels, the overall potassium current (IK) recorded at voltages from –80 to +80 mV. Middle panels, non-inactivating delayed-rectifier K+ current (IKD) preceded by a prepulse to +20 mV. Right panels, transient A-type current (IKA) obtained by subtracting the IKD. (B) Neuronal K+ current traces (depolarized at +20 mV from holding potential of –80 mV) recorded from another neuron before and after the application of 5 mM 4-AP. (C) Plot of IKD size as a function of voltage determined from neurons of cortical organoids at indicated ages and methadone treatments. (D,E) Scatter plot showing the peak IKD size (D) and density (E) of neurons from human cortical organoids with indicated ages and methadone treatments. (F) Plot of IKA size as a function of voltage determined from neurons of cortical organoids at indicated ages and methadone treatments. (G,H) Scatter plot showing the peak IKA size (G) and density (H) of neurons from human cortical organoids with indicated ages and methadone treatments. Graph of scatter plots display mean and SEM. n = 8–19 neurons (6–12 organoids). Two-way ANOVA followed by Tukey’s multiple comparisons test: (D) F(6, 162) = 10.80, p < 0.0001; (E) F(6, 162) = 3.80, p < 0.01; (G) F(6, 162) = 1.34, p = 0.24; (H) F(6, 162) = 0.45, p = 0.84. Control groups at 16-week, 20-week, 24-week were compared to 12-week group, ##p < 0.01, ###p < 0.001, ####p < 0.0001. Each methadone-treated groups were compared to the control group at the same age, *p < 0.05, **p < 0.01, ***p < 0.001, ****p < 0.0001.

