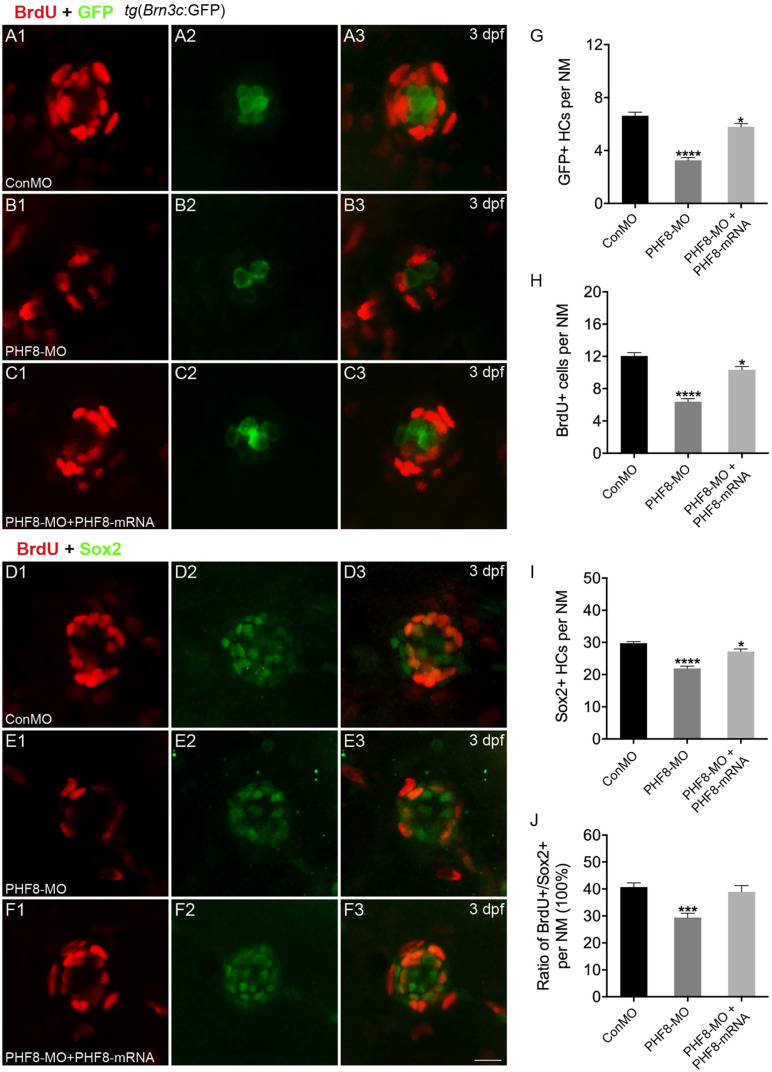
FIGURE 4.
Analysis of neuromast proliferation in PHF8 morphant. (A–C) Representative images of GFP (green) and BrdU (red) staining of neuromasts from control (ConMO; A), PHF8 morphants (PHF8-MO; B), and PHF8-MO co-injected with PHF8-mRNA embryo (PHF8-MO + PHF8-mRNA; C) at 3 dpf. Hair cells were assessed with GFP visualization in transgenic line tg(Brn3c:GFP). (D–F) Representative images of supporting cell marker Sox2 (green) and BrdU (red) staining of neuromasts from control (ConMO; D), PHF8 morphants (PHF8-MO; E), and PHF8-MO co-injected with PHF8-mRNA embryo (PHF8-MO + PHF8-mRNA; F) at 3 dpf. (G–J) The average number of GFP-positive hair cells (G), BrdU-positive cells (H), Sox2-positive supporting cells (I), and the ratio of BrdU + /Sox2 + cells per neuromast (NM) in control (ConMO), PHF8 morphants (PHF8-MO), and PHF8-MO co-injected with PHF8-mRNA embryo (PHF8-MO + PHF8-mRNA) at 3 dpf. n = 24 neuromasts per group, *p < 0.05, ***p < 0.001, ****p < 0.0001 vs. the ConMO group. Statistics are presented as means ± SEM. Scale bar, 10 μm. Neuromast, NM.

