
FIGURE 3.
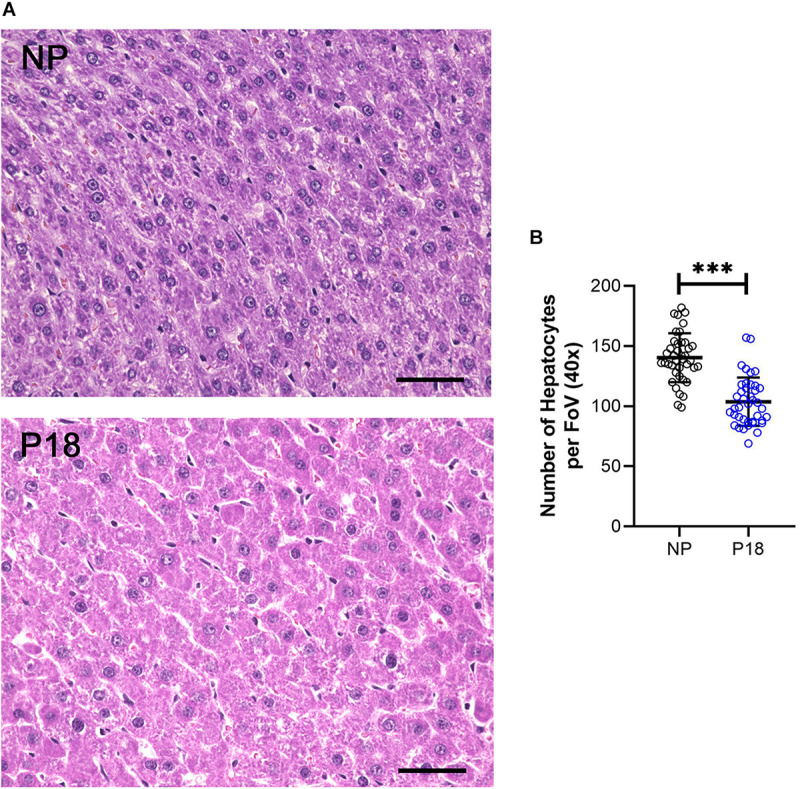
(A) Representative H&E-stained liver sections from non-pregnant (NP) and pregnant (P18) rats. Scale bars correspond to 50 μm. Hepatocytes were counted at 40x optical field, five high-power images per animal were analyzed. (B) Scatter plots of numbers of hepatocytes per field of view (FoV) in pregnant (P18) and non-pregnant (NP) groups with mean and standard deviation. ∗∗∗p < 0.001.