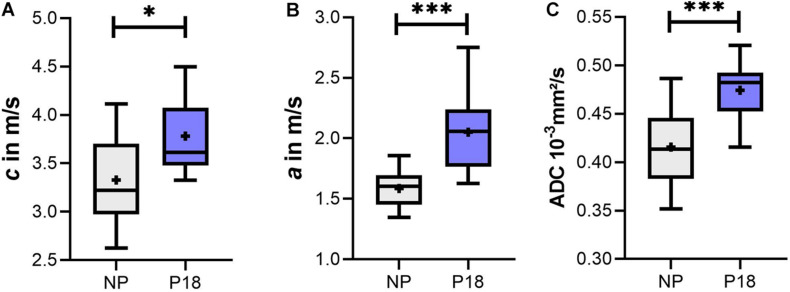
FIGURE 6.
Box plots of (A) shear wave speed (c), (B) penetration rate (a), and (C) apparent diffusion coefficient (ADC) of the liver in the pregnant (P18) and non-pregnant (NP) rat groups. Data are presented as minimum to maximum with interquartile range and median; + indicates means. ∗p ≤ 0.05 and ∗∗∗p ≤ 0.001.

