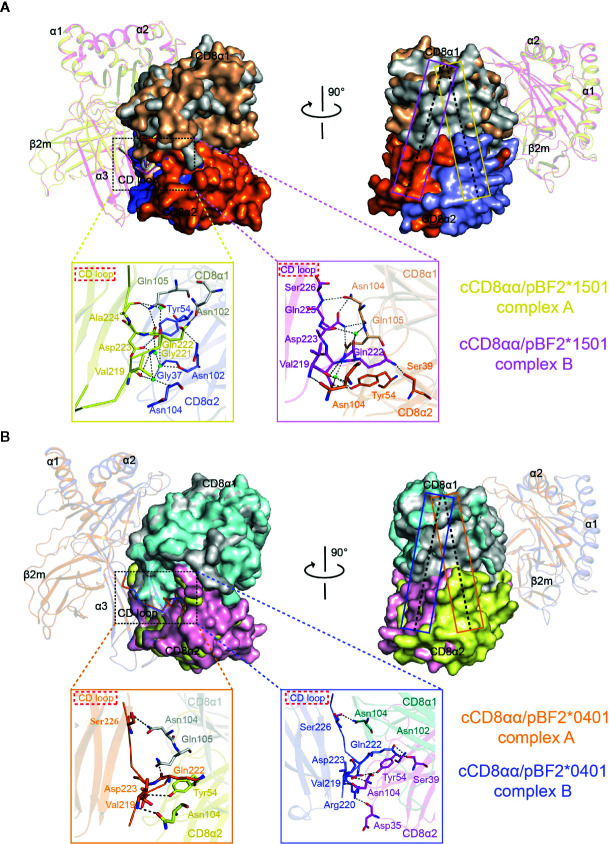
Figure 5.
Superposition of complex A and complex B of cCD8αα/pBF2*1501 and cCD8αα/pBF2*0401 using the Cα atoms of domains α1 and α2. (A) Overlap of complex A and complex B of cCD8αα/pBF2*1501 based on the Cα atoms of domains α1 and α2, as shown from the front view and in a clockwise rotation by 90°. The interaction details between the α3 domain CD loop and the cCD8αα homodimer are shown in an enlarged view in yellow and pink boxes for complex A and complex B, respectively. In complex A, the contact residues are shown in stick representation, and the residues of BF2*1501 are colored yellow. The residues of cCD8α1 are colored gray, the residues of cCD8α2 are colored light blue, and the interaction forces are marked by black dotted lines. In complex B, the contact residues are shown in stick representation, and the residues of BF2*1501 are colored light pink. The residues of cCD8α1 are colored light brown, the residues of cCD8α2 are colored orange, and the interaction forces are marked by black dotted lines. pBF2*1501 of cCD8αα/pBF2*1501 complex A and cCD8αα/pBF2*1501 complex B are colored yellow and light pink; the cCD8α1 and cCD8α2 subunits of the cCD8αα/pBF2*1501 complex A are colored light gray and light blue; and the cCD8α1 and cCD8α2 subunits of cCD8αα/pBF2*1501 complex B are colored light brown and orange. The yellow and pink rectangles represent the central plane of the cCD8αα homodimer of complex A and complex B of cCD8αα/pBF2*1501, respectively. (B) Overlap of complex A and complex B of cCD8αα/pBF2*0401 based on the Cα atoms of domains α1 and α2, shown from the front view and rotated clockwise by 90°. The interaction details between the α3 domain CD loop and the cCD8αα homodimer are shown in enlarged views in light orange and light blue boxes for complex A and complex B, respectively. In complex A, the contact residues are shown in stick representation, and the residues of BF2*0401 are colored light orange, the residues of cCD8α2 are colored yellow, and the interaction forces are marked by black dotted lines. In complex B, the contact residues are shown in stick representation, the residues of BF2*0401 are colored light blue, the residues of cCD8α1 are colored deep green, the residues of cCD8α2 are colored pink, and the interaction forces are marked by black dotted lines. pBF2*0401 of cCD8αα/pBF2*0401 complex A and cCD8αα/pBF2*0401 complex B are colored light orange and light blue; the cCD8α1 and cCD8α2 subunits of cCD8αα/pBF2*0401 complex A are colored gray and yellow; and the cCD8α1 and cCD8α2 subunits of cCD8αα/pBF2*0401 complex B are colored deep-green and pink. The orange and blue rectangles represent the central plane of the cCD8αα homodimer of complex A and complex B of cCD8αα/pBF2*0401, respectively.

