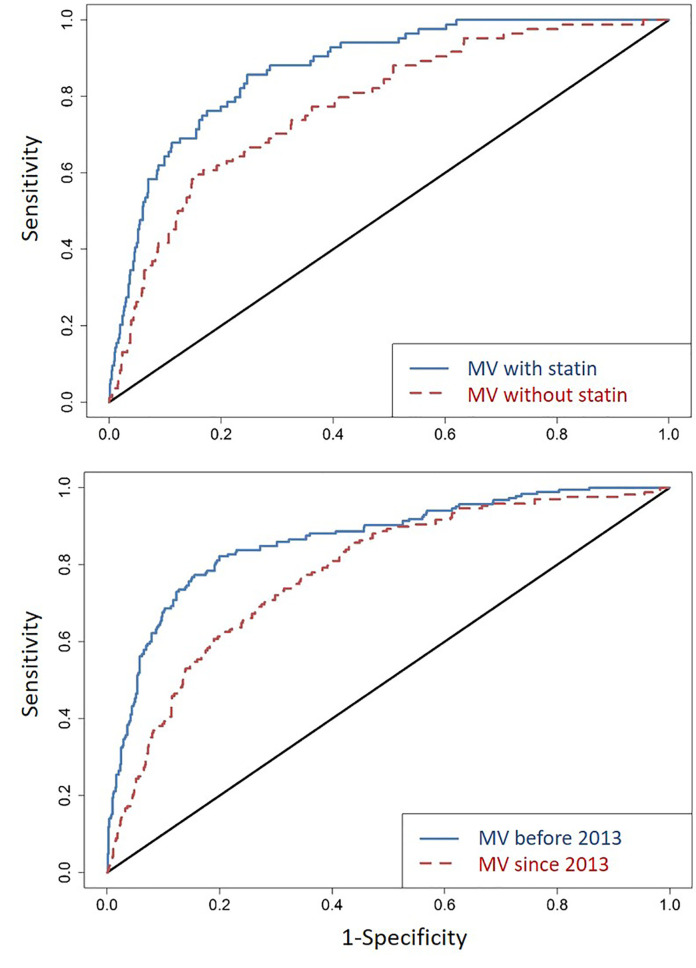
Figure 2.
Area under the receiver operating characteristics curves (ROCs) in several rounds of comparative analyses. First (top panel), for all factors identified as independent predictor of incident T2DM in a reduced multivariable (MV) model ( Table 2 ), the C-statistic for ROC (line in blue) is 0.87 (95% CI = 0.84-0.91); removing statin use from the model (line in red) leads to an ROC of 0.78 (95% CI = 0.73-0.83). Second (bottom panel), with reference to the new guidelines of statin therapy (introduced in 2013), T2DM diagnosed before 2013 (line in blue) and since 2013 (line in red) have ROC of 0.86 (95% CI = 0.83-0.90) and 0.86 (95% CI = 0.78-0.84), respectively.

